. 2019 Nov:537:186-197.
doi: 10.1016/j.virol.2019.09.001. Epub 2019 Sep 3.

Structural characterization of the PCV2d virus-like particle at 3.3 Å resolution reveals differences to PCV2a and PCV2b capsids, a tetranucleotide, and an N-terminus near the icosahedral 3-fold axes

Affiliations

Structural characterization of the PCV2d virus-like particle at 3.3 Å resolution reveals differences to PCV2a and PCV2b capsids, a tetranucleotide, and an N-terminus near the icosahedral 3-fold axes

Reza Khayat et al. Virology. 2019 Nov.

Abstract

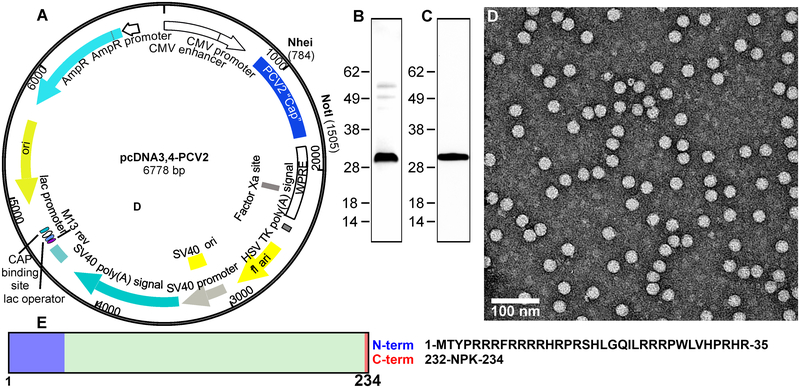
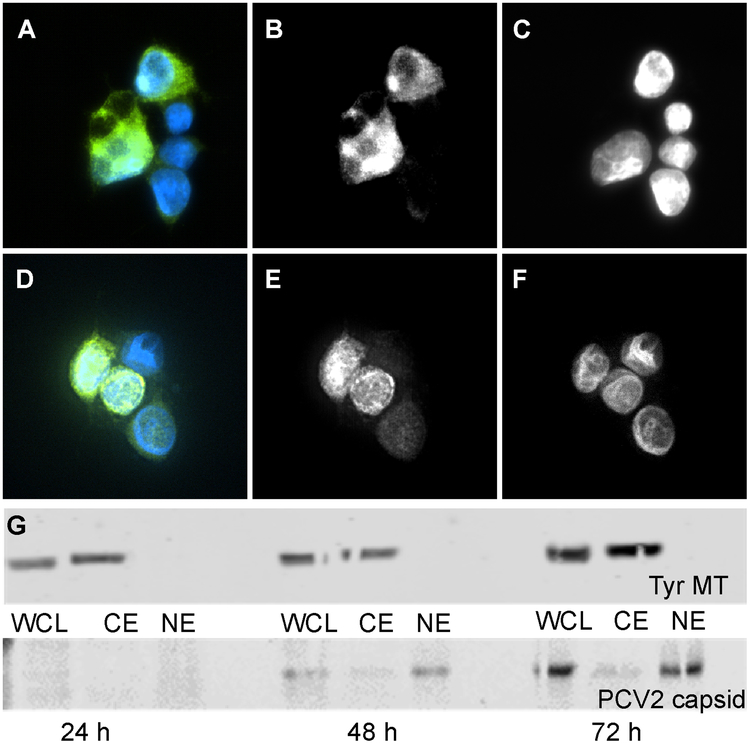
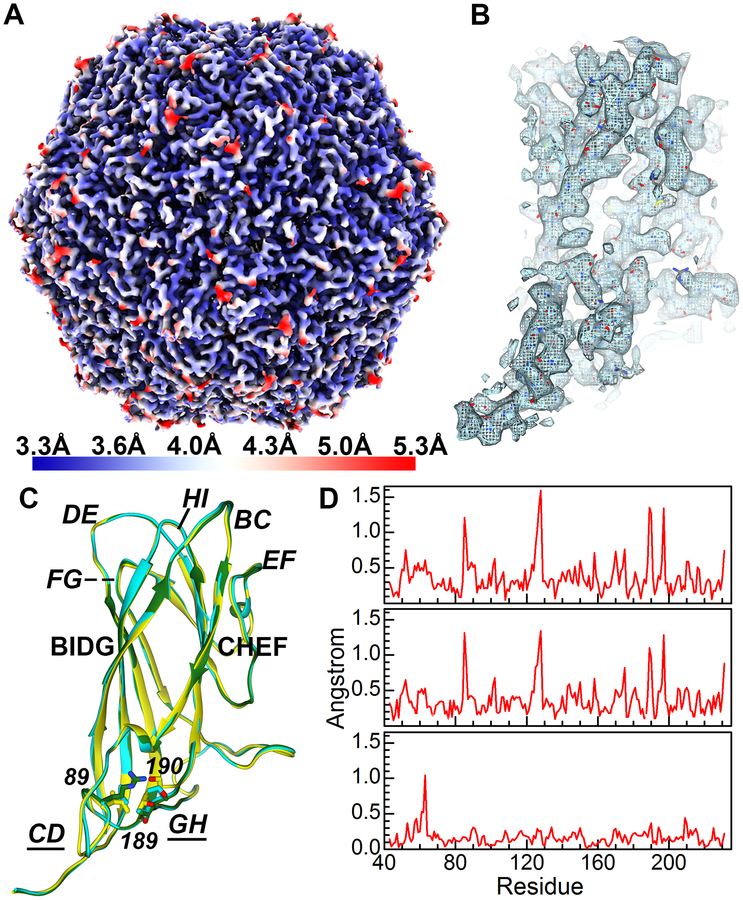
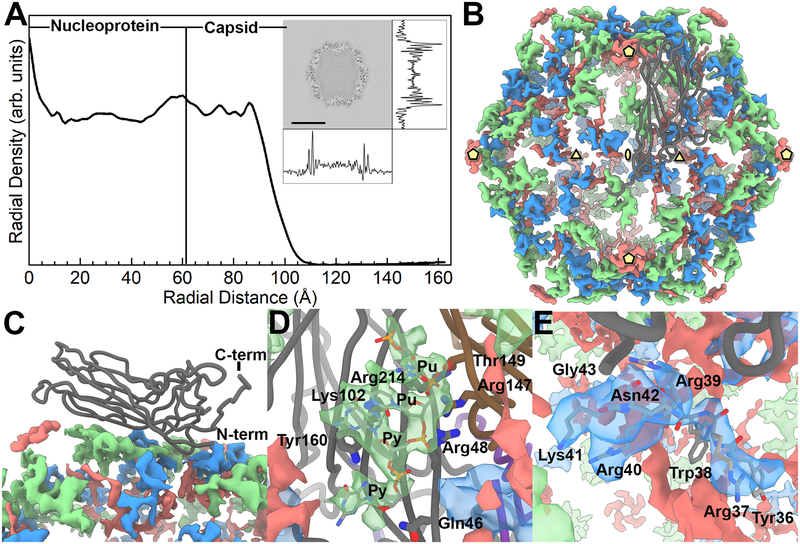
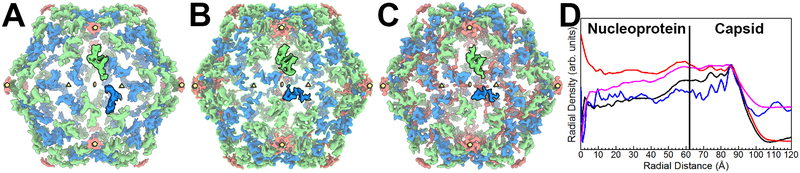
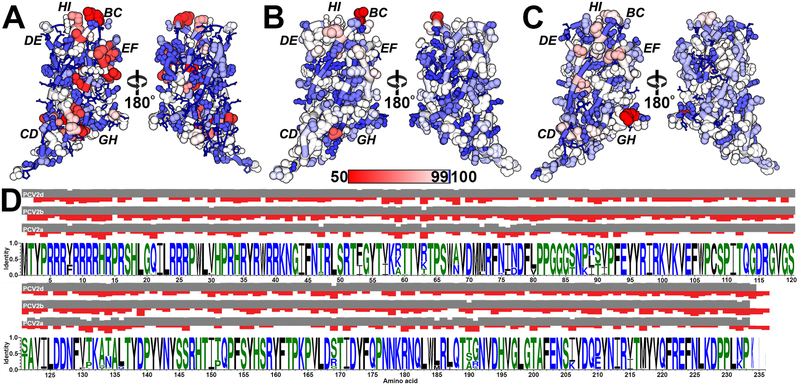
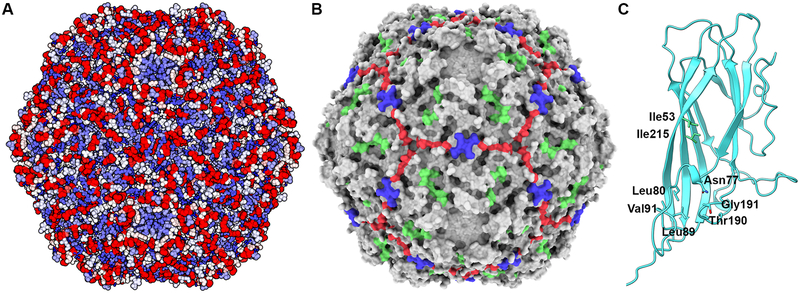
Porcine circovirus 2 (PCV2) has a major impact on the swine industry. Eight PCV2 genotypes (a-h) have been identified using capsid sequence analysis. PCV2d has been designated as the emerging genotype. The cryo-electron microscopy molecular envelope of PCV2d virus-like particles identifies differences between PCV2a, b and d genotypes that accompany the emergence of PCV2b from PCV2a, and PCV2d from PCV2b. These differences indicate that sequence analysis of genotypes is insufficient, and that it is important to determine the PCV2 capsid structure as the virus evolves. Structure-based sequence comparison demonstrate that each genotype possesses a unique combination of amino acids located on the surface of the capsid that undergo substitution. We also demonstrate that the capsid N-terminus moves in response to increasing amount of nucleic acid packaged into the capsid. Furthermore, we model a tetranucleotide between the 5- and 2-fold axes of symmetry that appears to be responsible for capsid stability.

Keywords: Capsid structure; Circovirus; Cryo-electron microscopy; Virus evolution; Virus-like particle (VLP).


Figures

Figure 1.
Figure 1.. Expression of PCV2 virus-like particles in mammalian cells.
A) Plasmid generated for expression of PCV2d CP. The codon optimized PCV2d capsid gene was synthesized (Blue Heron Technologies, Bothell, WA) and cloned into expression vector pcDNA3.4 (Fisher Scientific). B) Protein expression was conducted in transiently transfected suspension cultures of Expi293 cells (Life Technologies). SDS-PAGE analysis of purified PCV2d VLPs (1 ug protein) and stained with Coomassie blue. C) SDS-PAGE analysis of purified PCV2d VLPs (0.5 ug protein) transferred to a nitrocellulose membrane and probed for a Western Blot with primary rabbit anti PCV2 capsid polyclonal antibody (Cab 183908, Abcam, UK). D) Negative stained electron microscopy micrograph of purified VLP stained with uranyl acetate. Particle sizes are approximately19 nm diameter. E) Schematic for C (234 amino acids). The amino acids that could not be modeled into the molecular envelopes are shown in blue and red.
Figure 2.
Figure 2.. Location of expressed PCV2d capsid protein in transfected HEK293 cell.
Transfected cells were fixed with acetone and labeled with mouse anti-PCV2 capsid monoclonal antibody to probe the capsid (green) and with DAPI (blue) to localize the nuclei. A) images from cells 48 hours post transfection with immunofluorescence from the capsid shown by the green channel and fluorescence from DAPI (nucleus labeling) by the blue channel. B) same image showing information from the green channel (capsid), C) same image showing information from the blue channel labeling (nucleus). D) images from cells 72 hours post transfection with immunofluorescence identical to A). E) same image showing information from the green channel (capsid), F) same image showing information from the blue channel (nucleus). G) Western blot analysis of whole cell lysate (WCL), cytoplasm (CE) and nuclear extracts (NE) collected 24, 48 and 72 hours post transfection. Top panel) The samples were probed for tyrosinated microtubules. Bottom panel) The samples were probed for PCV2 CP. The presence of tyrosinated microtubules in CE but not in NE provided the quality control of cell fractionation.
Figure 3.
Figure 3.. Structural study of the PCV2d VLP.
A) Icosahedral cryo-EM molecular envelope of the purified PCV2d VLP colored according to the local resolution. The gradient color map on the left-hand side indicates the resolution for the colors. B) Extracted molecular envelope for a subunit demonstrates the quality of the molecular envelope, where amino acid side chains can clearly be seen. The atomic coordinates have been modeled into the molecular envelope. C) Structural overlay of the PCV2a (yellow), PCV2b (green), and PCV2d (cyan). Amino acids 89, 189 and 190 are shown as stick models. The β-strands (bold) loops (bold-italic) are labeled. Loop CD (amino acids 75–94) and loop GH (163–194) where movement is observed. Figures generated using UCSF Chimera and ChimeraX (Goddard et al., 2018; Pettersen et al., 2004). D) Distances between equivalent amino acids (Cα atoms) are plotted after superposition of two PCV2 structures PCV2a-PCV2b (top), PCV2a-PCV2d (middle), and PCV2b-PCV2d (bottom).
Figure 4.
Figure 4.. The inner content of the PCV2 capsid.
A) A radial profile of the PCV2d cryo-EM molecular envelope. The capsid interior and shell are identified by assessing the cryo-EM molecular envelope. The inset is a central slice extracted from the cryo-EM molecular envelope, with the density trace of pixel values calculated in the horizontal and vertical directions. The radial profile demonstrates that number of voxels within the capsid is comparable to the capsid shell; thus, a substantial amount of material is located within the capsid interior. B) Strong difference peaks identified in the inner capsid. The icosahedral 5-, 3- and 2-fold axes of symmetry are identified by yellow pentagons, triangles and ellipses, respectively. A CP subunit is shown as a dark grey tube. We interpret the green colored difference peak to be a Pu-Pu-Py-Py tetranucleotide, the blue colored difference peak to be amino acids 36–41 of the PCV2 N-terminus, and the red colored difference peak to be “unidentified”. C) Side view showing the CP subunit and the difference peaks. D) Close up of the tetranucleotide that has been modeled into the difference peak (green) located near the 3-fold axes of symmetry, and the CP amino acids in proximity. Gln46 (strand B), Arg48 (strand B), Lys102 (strand D), and Arg214 (strand I) of one subunit, and Thr149 (strand F) and Arg147 (strand F) from a neighboring subunit form hydrogen bonds and electrostatic interaction with the phosphate backbones of the tetranucleotide. Tyr160 (strand I) forms π-bond overlap with the first Py in the tetranucleotide. E) Close up of the PCV2 N-terminus modeled into the difference peak (blue) located near the 3-fold axes of symmetry. Amino acids 36–42 are labeled.
Figure 5.
Figure 5.. Inner capsid difference peaks of PCV2a, PCV2b and PCV2d.
Comparing the difference peaks in the inner capsid of PCV2a (A), PCV2b (B) and PCV2d (C) reveals a conserved location for the tetranucleotide molecular envelope (green) and differences for the N-termini molecular envelope (blue). The orientation of the PCV2b and PCV2d N-termini are conserved; however, the N-termini of the PCV2a are rotated ~90° clockwise. The icosahedral symmetry elements are shown using the same convention as Fig. 4B. The molecular envelopes for a single subunit (one of sixty) are painted with bold colors. D) Radial plots of PCV2a (blue, EMDB 6555), PCV2b (black, EMDB 8939), PCV2d (red, EMDB 20113), and PCV2 expressed in E. coli (light blue, EMDB 6746). The plots are normalized and scaled to one another to simplify the comparison. The PCV2d molecular envelope possesses the greatest amount of content within its capsid, while the PCV2a molecular envelope possesses the least amount of content within its capsid.
Figure 6.
Figure 6.. Sequence diversity and variability in the PCV2a, b, d genotypes.
A) Amino acid sequence alignment information plotted on the PCV2a, b, and d coordinates. The red-to-blue color gradient represents diversity (sequence identity) -gradient shown in the middle of the image. The size of the atoms and tube represent variation (AL2CO: sequence entropy), with smaller atoms/tubes representing lower entropy/variation and larger atoms/tubes representing greater entropy/variation. Lower entropy indicates fewer different amino acids present in the alignment at a position, and larger entropy indicates more different amino acids present at a position. The plotting of variation allows one to appreciate the frequency of different amino acids at each position. Left, amino acids facing the capsid exterior. Right, amino acids facing the capsid interior. A) Attained from 317 unique CP entries plotted on the surface of the PCV2a atomic coordinates (PDB entry 3JCI). B) attained from 501 unique CP entries plotted on the surface of the PCV2b atomic coordinates (PDB entry 6DZU). C) attained from 368 unique CP entries plotted on the surface of the PCV2d atomic coordinates (PDB entry 6OLA). D) WebLogo image of the PCV2a, PCV2b, and PCV2d CP entries (Schneider and Stephens, 1990). The grey and red bars represent the sequence diversity (identity) and variability (entropy) for each amino acid position. Values for sequence diversity and variability were calculated using the ALCO server (Pei and Grishin, 2001).
Figure 7.
Figure 7.. Sequence comparison of 1,278 PCV2 capsid protein entries plotted on the PCV2d atomic coordinates.
A) The sequence diversity and variation plotted on the PCV2d atomic coordinates -same coloring scheme as in Fig. 6. Image made with UCSF Chimera (Pettersen et al., 2004). B) Surface representation of the PCV2d atomic coordinates with the three conserved patches colored in green (Tyr55, Thr56, Asp70, Met71, Arg73, Asp127), blue (Pro82, Gly83, Gly85) and red (Asp168, Thr170, Gln188, Thr189). Image made with UCSF ChimeraX and colored using flat lighting (Goddard et al., 2018). C) Ribbon cartoon of a PCV2d subunit. Amino acids in stick are evolutionary coupled together, as determined using the plmc. MATLAB 2019, and EVzoom programs. Figures generated using UCSF Chimera (Pettersen et al., 2004).

Similar articles

Cited by

References

    1. Afonine PA, Headd JJ, Terwilliger TC, Adams PC, 2013. Computational Crystallography Newsletter 4, 43–44.
    1. Beach NM, Meng XJ, 2012. Efficacy and future prospects of commercially available and experimental vaccines against porcine circovirus type 2 (PCV2). Virus Res 164, 33–42. - PubMed
    1. Breitbart M, Delwart E, Rosario K, Segales J, Varsani A, Ictv Report C, 2017. ICTV Virus Taxonomy Profile: Circoviridae. J Gen Virol 98, 1997–1998. - PMC - PubMed
    1. Cai L, Ni J, Xia Y, Zi Z, Ning K, Qiu P, Li X, Wang B, Liu Q, Hu D, Yu X, Zhou Z, Zhai X, Han X, Tian K, 2012. Identification of an emerging recombinant cluster in porcine circovirus type 2. Virus Res 165, 95–102. - PubMed
    1. Correa-Fiz F, Franzo G, Llorens A, Segales J, Kekarainen T, 2018. Porcine circovirus 2 (PCV-2) genetic variability under natural infection scenario reveals a complex network of viral quasispecies. Sci Rep 8, 15469. - PMC - PubMed

Publication types

LinkOut - more resources