

μLAS technology for DNA isolation coupled to Cas9-assisted targeting for sequencing and assembly of a 30 kb region in plant genome
- PMID: 31505675
- PMCID: PMC6736094
- DOI: 10.1093/nar/gkz632
μLAS technology for DNA isolation coupled to Cas9-assisted targeting for sequencing and assembly of a 30 kb region in plant genome
Abstract
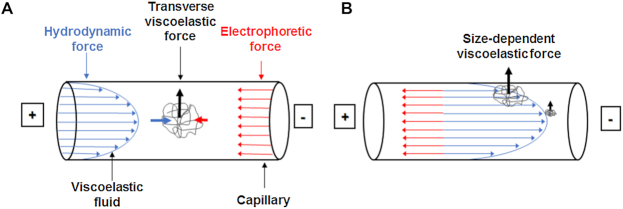
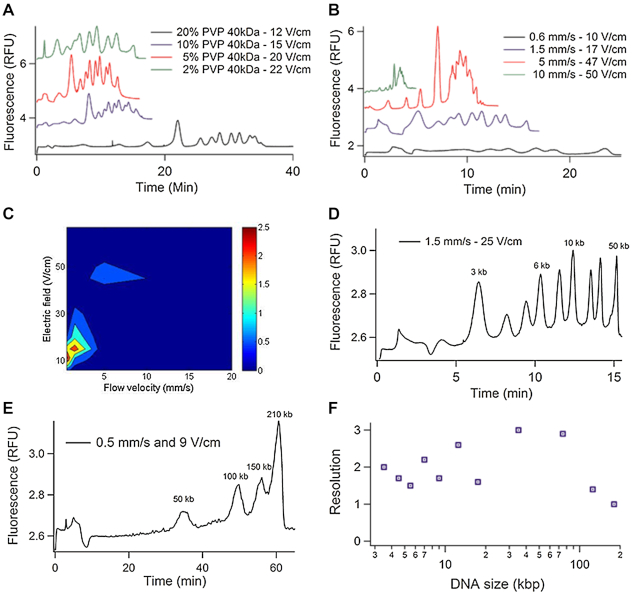
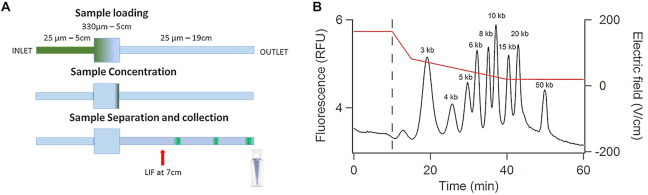
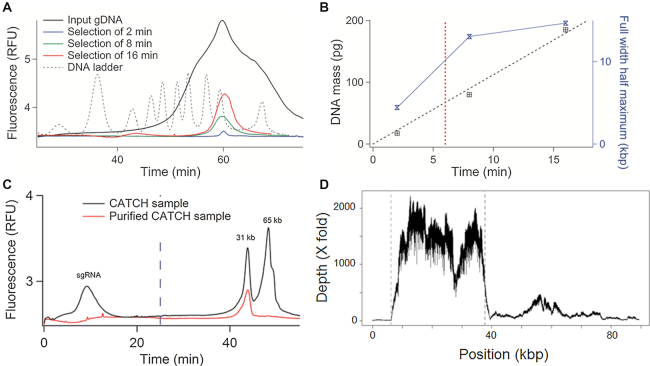
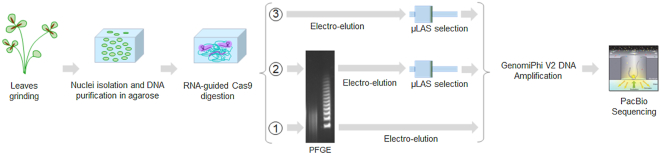
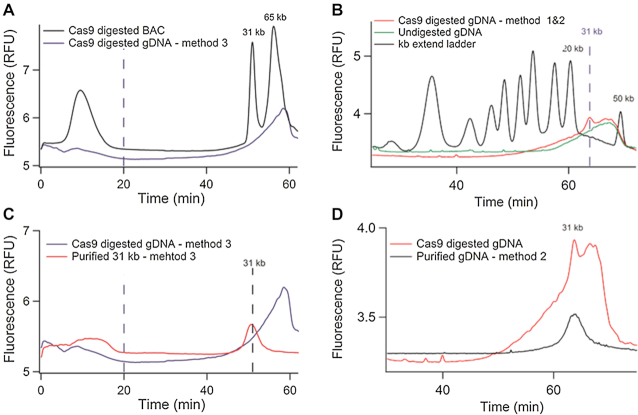
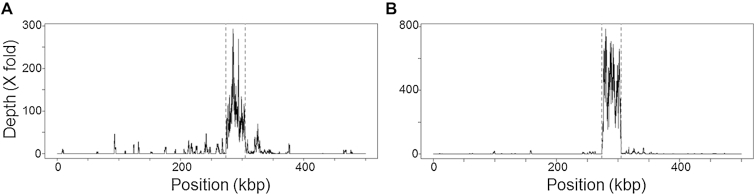
Cas9-assisted targeting of DNA fragments in complex genomes is viewed as an essential strategy to obtain high-quality and continuous sequence data. However, the purity of target loci selected by pulsed-field gel electrophoresis (PFGE) has so far been insufficient to assemble the sequence in one contig. Here, we describe the μLAS technology to capture and purify high molecular weight DNA. First, the technology is optimized to perform high sensitivity DNA profiling with a limit of detection of 20 fg/μl for 50 kb fragments and an analytical time of 50 min. Then, μLAS is operated to isolate a 31.5 kb locus cleaved by Cas9 in the genome of the plant Medicago truncatula. Target purification is validated on a Bacterial Artificial Chromosome plasmid, and subsequently carried out in whole genome with μLAS, PFGE or by combining these techniques. PacBio sequencing shows an enrichment factor of the target sequence of 84 with PFGE alone versus 892 by association of PFGE with μLAS. These performances allow us to sequence and assemble one contig of 29 441 bp with 99% sequence identity to the reference sequence.
© The Author(s) 2019. Published by Oxford University Press on behalf of Nucleic Acids Research.
Figures
Similar articles
-
Strategies for optimizing BioNano and Dovetail explored through a second reference quality assembly for the legume model, Medicago truncatula.BMC Genomics. 2017 Aug 4;18(1):578. doi: 10.1186/s12864-017-3971-4. BMC Genomics. 2017. PMID: 28778149 Free PMC article.
-
CRISPR/Cas mutagenesis of soybean and Medicago truncatula using a new web-tool and a modified Cas9 enzyme.GM Crops Food. 2015;6(4):243-52. doi: 10.1080/21645698.2015.1106063. GM Crops Food. 2015. PMID: 26479970 Free PMC article.
-
Population genomic analysis of Tunisian Medicago truncatula reveals candidates for local adaptation.Plant J. 2010 Aug;63(4):623-35. doi: 10.1111/j.1365-313X.2010.04267.x. Plant J. 2010. PMID: 20545888
-
Sequencing the genespaces of Medicago truncatula and Lotus japonicus.Plant Physiol. 2005 Apr;137(4):1174-81. doi: 10.1104/pp.104.057034. Plant Physiol. 2005. PMID: 15824279 Free PMC article. Review. No abstract available.
-
Rapid CRISPR/Cas9-Mediated Cloning of Full-Length Epstein-Barr Virus Genomes from Latently Infected Cells.Viruses. 2018 Apr 3;10(4):171. doi: 10.3390/v10040171. Viruses. 2018. PMID: 29614006 Free PMC article. Review.
Cited by
-
Recent Advances in Strategies for the Cloning of Natural Product Biosynthetic Gene Clusters.Front Bioeng Biotechnol. 2021 Jul 13;9:692797. doi: 10.3389/fbioe.2021.692797. eCollection 2021. Front Bioeng Biotechnol. 2021. PMID: 34327194 Free PMC article. Review.
-
Hybridization-based DNA biosensing with a limit of detection of 4 fM in 30 s using an electrohydrodynamic concentration module fabricated by grayscale lithography.Biomicrofluidics. 2022 Aug 16;16(4):044111. doi: 10.1063/5.0073542. eCollection 2022 Jul. Biomicrofluidics. 2022. PMID: 35992636 Free PMC article.
-
Detection of EGFR mutations at pM concentration in ten minutes using a microfluidic concentration and separation module.Biomed Microdevices. 2025 Aug 28;27(3):40. doi: 10.1007/s10544-025-00767-w. Biomed Microdevices. 2025. PMID: 40875066 Free PMC article.
References
-
- Pecrix Y., Staton S.E., Sallet E., Lelandais-Brière C., Moreau S., Carrère S., Blein T., Jardinaud M.-F., Latrasse D., Zouine M.. Whole-genome landscape of Medicago truncatula symbiotic genes. Nat. Plants. 2018; 4:1017–1025. - PubMed
-
- Bevan M.W., Uauy C., Wulff B.B., Zhou J., Krasileva K., Clark M.D.. Genomic innovation for crop improvement. Nature. 2017; 543:346–354. - PubMed
-
- Mamanova L., Coffey A.J., Scott C.E., Kozarewa I., Turner E.H., Kumar A., Howard E., Shendure J., Turner D.J.. Target-enrichment strategies for next-generation sequencing. Nat. Methods. 2010; 7:111–118. - PubMed
Publication types
MeSH terms
Substances
LinkOut - more resources
Full Text Sources
Other Literature Sources
