. 2019 Sep 9;20(18):4424.
doi: 10.3390/ijms20184424.

FMK, an Inhibitor of p90RSK, Inhibits High Glucose-Induced TXNIP Expression via Regulation of ChREBP in Pancreatic β Cells

Affiliations

FMK, an Inhibitor of p90RSK, Inhibits High Glucose-Induced TXNIP Expression via Regulation of ChREBP in Pancreatic β Cells

Jung-Hwa Han et al. Int J Mol Sci. .

Abstract

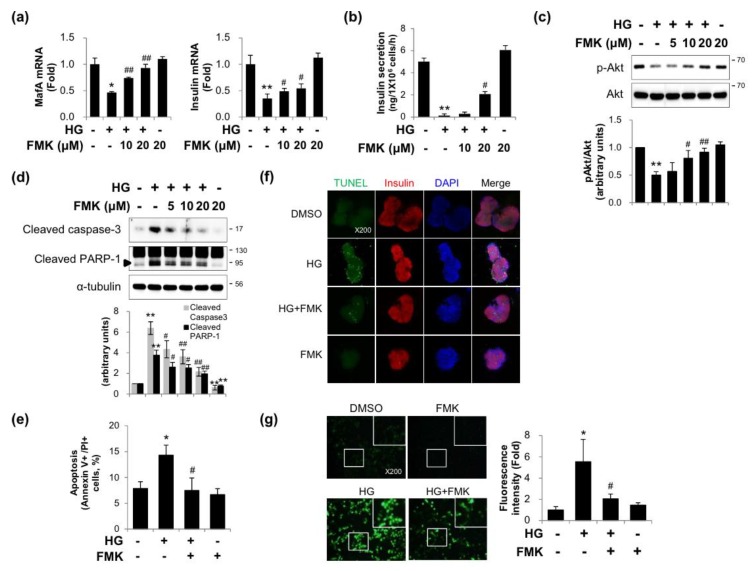
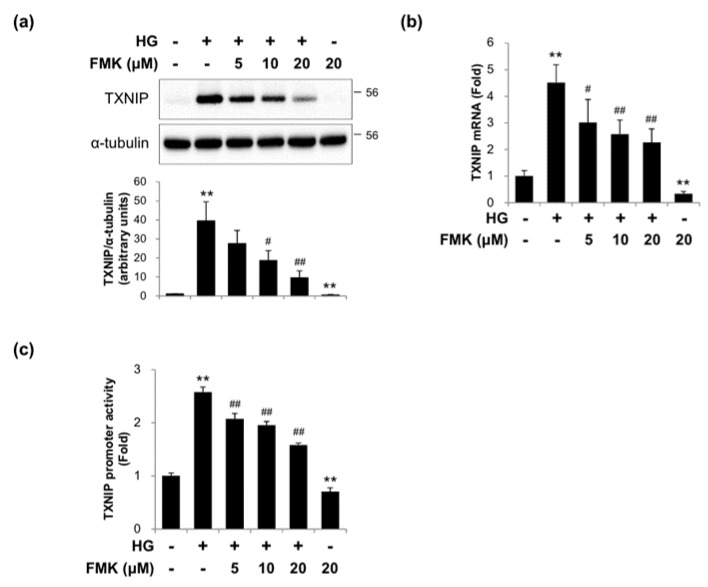
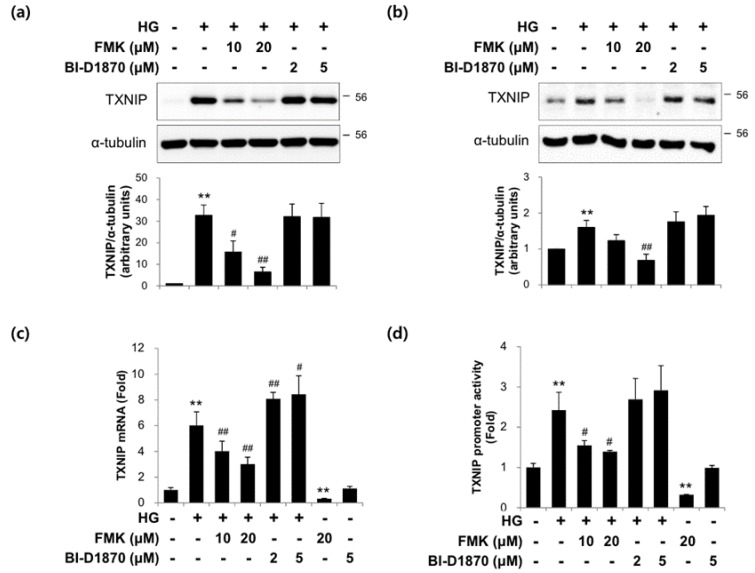
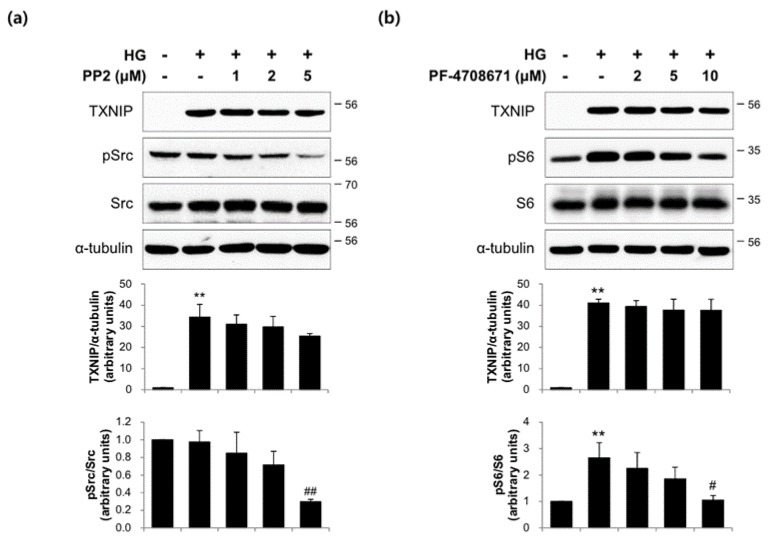
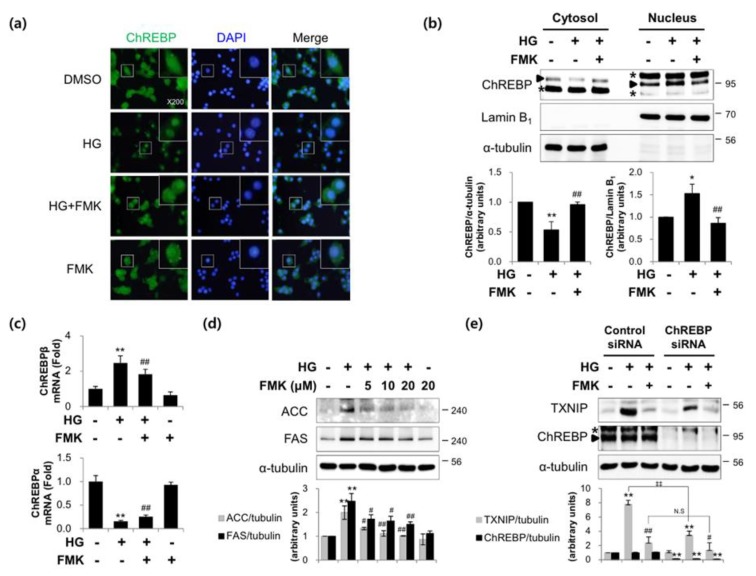
Hyperglycemia is the major characteristic of diabetes mellitus, and a chronically high glucose (HG) level causes β-cell glucolipotoxicity, which is characterized by lipid accumulation, impaired β-cell function, and apoptosis. TXNIP (Thioredoxin-interacting protein) is a key mediator of diabetic β-cell apoptosis and dysfunction in diabetes, and thus, its regulation represents a therapeutic target. Recent studies have reported that p90RSK is implicated in the pathogenesis of diabetic cardiomyopathy and nephropathy. In this study, we used FMK (a p90RSK inhibitor) to determine whether inhibition of p90RSK protects β-cells from chronic HG-induced TXNIP expression and to investigate the molecular mechanisms underlying the effect of FMK on its expression. In INS-1 pancreatic β-cells, HG-induced β-cell dysfunction, apoptosis, and ROS generation were significantly diminished by FMK. In contrast BI-D1870 (another p90RSK inhibitor) did not attenuate HG-induced TXNIP promoter activity or TXNIP expression. In addition, HG-induced nuclear translocation of ChREBP and its transcriptional target molecules were found to be regulated by FMK. These results demonstrate that HG-induced pancreatic β-cell dysfunction resulting in HG conditions is associated with TXNIP expression, and that FMK is responsible for HG-stimulated TXNIP gene expression by inactivating the regulation of ChREBP in pancreatic β-cells. Taken together, these findings suggest FMK may protect against HG-induced β-cell dysfunction and TXNIP expression by ChREBP regulation in pancreatic β-cells, and that FMK is a potential therapeutic reagent for the drug development of diabetes and its complications.

Keywords: ChREBP; FMK; INS-1; TXNIP; p90RSK.


Conflict of interest statement

The authors have no conflict of interest to declare. The funders had no role in the design of the study; in the collection, analyses, or interpretation of data; in the writing of the manuscript, or in the decision to publish the results.

Figures

Figure 1
Figure 1
FMK pretreatment prevented high glucose-induced β-cell dysfunction, apoptosis, and oxidative stress. (a) INS-1 cells were pretreated with FMK (10 or 20 μM) for 1 h, and then incubated with high glucose (HG, 25 mM) for 24 h. mRNA levels of MafA and insulin were measured by qRT-PCR. Relative expression levels were normalized versus GAPDH. Results are expressed as means ± SD and are representative of three independent experiments. * p < 0.05 and ** p < 0.01 vs. non-treated controls, # p < 0.05 and ## p < 0.01 vs. HG-treated cells. (b) INS-1 cells were pretreated with FMK (10 or 20 μM) for 1 h, and then incubated with HG for 48 h, and then replaced with fresh medium. After 5 h recovery, the cells were subsequently simulated with KRB supplemented with HG for 1 h, and then the medium was collected for detection of glucose-stimulated insulin secretion (GSIS). Insulin secretion was determined by ELISA kit. Results are expressed as means ± SD and are representative of three independent experiments. ** p < 0.01 vs. non-treated controls, # p < 0.05 vs. HG-treated cells. (c,d) INS-1 cells were pretreated with FMK (5, 10 or 20 μM) for 1 h, and then incubated with HG for 48 h. Protein levels were measured by immunoblotting. The graph shows the densitometric quantification of western blot bands. Results are expressed as means ± SDs and are representative of three independent experiments. ** p < 0.01 vs. non-treated controls, # p < 0.05 and ## p < 0.01 vs. HG-treated cells. (e) INS-1 cells were pretreated with FMK (20 μM) for 1 h and then incubated with HG for 48 h. The status of apoptotic cell death was determined by counting cells stained with annexin V-FITC/PI using a flow cytometer. (f) Primary rat islets were pretreated with FMK (20 μM) for 1 h and then incubated with HG for 48 h. Cells were subjected to TUNEL staining. Representative photomicrographs showing TUNEL (apoptotic, green), insulin (pancreatic β-cells, red), and DAPI (nuclei, blue) signals and merged images (original magnification, ×200). (g) Representative images of ROS accumulation as determined using the fluorescent probe H2DCFDA. INS-1 cells were pretreated with FMK (20 μM) for 1 h and then incubated with HG for 48 h. These images were obtained by fluorescence microscope (original magnification, ×200). Results in bar graphs are presented as the means ± SDs of three independent experiments. * p < 0.05 vs. non-treated controls, # p < 0.05 vs. HG-treated cells.
Figure 2
Figure 2
FMK inhibited high glucose-induced TXNIP expression. (a) INS-1 cells were pretreated with FMK (5, 10 or 20 μM) for 1 h, and then incubated with high glucose (HG, 25 mM) for 24 h. Protein levels were measured by immunoblotting using antibodies against TXNIP and α-tubulin. The graph shows the densitometric quantification of western blot bands. Results are expressed as means ± SDs and are representative of three independent experiments. ** p < 0.01 vs. non-treated controls, # p < 0.05 and ## p < 0.01 vs. HG-treated cells. (b) INS-1 cells were pretreated with FMK (5, 10 or 20 μM) for 1 h, and then incubated with HG for 24 h. mRNA levels of TXNIP were measured by qRT-PCR. Relative expression levels were normalized versus GAPDH. Results are expressed as the means ± SDs of three independent experiments. ** p < 0.01 vs. non-treated controls, # p < 0.05 and ## p < 0.01 vs. HG-treated controls. (c) INS-1 cells were transfected with a TXNIP-luc containing construct driven by full-length TXNIP promoter, and after 24 h of transfection were pretreated with FMK (5, 10 or 20 μM) for 1 h, and then incubated with HG for 24 h. Luciferase activities in cell lysates were determined using a dual luciferase reporter assay kit with a Glomax 20/20 luminometer. Transfection efficiencies were normalized versus Renilla luciferase activity derived from pRL-tk construct. Results are expressed as the means ± SDs of three independent experiments. ** p < 0.01 vs. non-treated controls, ## p < 0.01 vs. HG-treated controls.
Figure 3
Figure 3
FMK (a CTKD inhibitor of p90RSK) inhibited TXNIP expression, but not BI-D1870 (a NTKD inhibitor of p90RSK). (a) INS-1 cells and (b) primary rat islets were pretreated with FMK (10 or 20 μM) or BI-D1870 (2 or 5 μM) for 1 h, and then incubated with high glucose (HG, 25 mM) for 24 h. Protein levels were measured by immunoblotting. The graph shows the densitometric quantification of western blot bands. Results are expressed as means ± SDs and are representative of three independent experiments. ** p < 0.01 vs. non-treated controls, # p < 0.05 and ## p < 0.01 vs. HG-treated cells. (c) INS-1 cells were pretreated with FMK (10 or 20 μM) or BI-D1870 (2 or 5 μM) for 1 h, and then incubated with HG for 24 h. mRNA levels of TXNIP were measured by qRT-PCR. Relative expression levels were normalized versus GAPDH. Results are expressed as the means ± SDs of three independent experiments. ** p < 0.01 vs. non-treated controls, # p < 0.05 and ## p < 0.01 vs. HG-treated cells. (d) INS-1 cells were transfected with TXNIP-luc containing construct driven by the full-length TXNIP promoter and 24 h later pretreated with FMK (10 or 20 μM) or BI-D1870 (2 or 5 μM) for 1 h, and then incubated with HG for 24 h. Luciferase activities in cell lysates were assessed using a dual luciferase reporter assay kit with a Glomax 20/20 luminometer. Transfection efficiencies were normalized versus Renilla luciferase activity derived from a pRL-tk construct. Results are expressed as the means ± SDs of three independent experiments. ** p < 0.01 vs. non-treated controls, # p < 0.05 vs. HG-treated cells.
Figure 4
Figure 4
Src and S6K1 kinases were not involved on HG-induced TXNIP expression. (a) INS-1 cells were pretreated with PP2 (1, 2 or 5 μM; an inhibitor of Src) for 1 h, and then incubated in high glucose (HG, 25 mM) for 24 h. Protein levels were measured by immunoblotting. The graph shows the densitometric quantification of western blot bands. Results are expressed as means ± SDs and are representative of three independent experiments. * p < 0.05 vs. non-treated controls, # p < 0.05 vs. HG-treated cells (b) INS-1 cells were pretreated with PF-4708671 (2, 5 or 10 μM; an inhibitor of S6K1) for 1 h, and then incubated with HG for 24 h. Protein levels were measured by immunoblotting. The graph shows the densitometric quantification of western blot bands. Results are expressed as means ± SDs and are representative of three independent experiments. * p < 0.05 and ** p < 0.01 vs. non-treated controls, # p < 0.05 vs. HG-treated cells.
Figure 5
Figure 5
FMK reduced the HG-induced nuclear translocation and activity of ChREBP. (a) INS-1 cells were pretreated with FMK (20 μM) for 1 h, and then incubated with high glucose (HG, 25 mM) for 6 h. Cells were stained with anti-ChREBP antibody, and nuclei were stained with DAPI and examined under a fluorescence microscope (original magnification, ×200). (b) INS-1 cells were pretreated with FMK (20 μM) for 1 h and then incubated with HG for 6 h. Cytosolic and nuclear protein extracts were isolated, and protein levels were measured by immunoblotting. The asterisk indicates a non-specific band. (c) INS-1 cells were pretreated with FMK (20 μM) for 1 h, and then incubated with HG for 24 h. mRNA levels of ChREBPα and ChREBPβ were measured by qRT-PCR. Relative expression levels were normalized versus GAPDH. Results are expressed as the means ±SDs of three independent experiments. * p < 0.05 and ** p < 0.01 vs. non-treated controls, # p < 0.05 and ## p < 0.01 vs. HG-treated cells (d) INS-1 cells were pretreated with FMK (20 μM) for 1 h, and then incubated with HG for 24 h. Protein levels were assessed by immunoblotting. (e) INS-1 cells were transfected with control or ChREBP siRNA (100 pM). After 48 h, cells were pretreated with FMK (20 μM), and then incubated with HG for 24 h. Protein levels were measured by immunoblotting. The graph shows the densitometric quantification of western blot bands. Results are expressed as means ± SDs and are representative of three independent experiments. ** p < 0.01 vs. non-treated controls, # p < 0.05 vs. HG-treated cells, ‡‡p < 0.01; N.S., not significant. The asterisk indicates a non-specific band.
Figure 6
Figure 6
Glucose 6-phosphate was not involved in the inhibition of the HG-induced ChREBP activation by FMK. INS-1 cells were pretreated with FMK (20 μM) for 1 h, and then incubated with high glucose (HG, 25 mM) for 6 or 24 h. Intracellular concentrations of glucose 6-phosphate (G6P) were measured using a G6P colorimetric assay Kit. Results are presented as bar graphs and are the means ±SDs of three independent experiments. ** p < 0.05 vs. non-treated controls; N.S., not significant.
Figure 7
Figure 7
FMK pretreatment reduced tunicamycin-induced TXNIP expression. (a) INS-1 cells were pretreated with FMK (5, 10 or 20 μM) for 1 h, and then treated with tunicamycin (TM, 10 μM) for 9 h. Protein levels were measured by immunoblotting. The graph shows the densitometric quantification of western blot bands. Results are expressed as means ± SDs and are representative of three independent experiments. ** p < 0.01 vs. non-treated controls, ## p < 0.05 vs. HG-treated cells. (b) INS-1 cells were pretreated with FMK (20 μM) for 1 h, and then incubated with TM for 9 h. mRNA levels of TXNIP were measured by qRT-PCR. Relative expression levels were normalized versus GAPDH. Results are expressed as the means ± SDs of three independent experiments. * p < 0.05 and ** p < 0.01 vs. non-treated controls, # p < 0.05 vs. TM-treated cells. (c) INS-1 cells were transfected with TXNIP-luc for 24 h, pretreated with FMK (20 μM) for 1 h, and then treated with TM for 9 h. Luciferase activities in cell lysates were assessed using a dual luciferase reporter assay kit with a Glomax 20/20 luminometer. Transfection efficiencies were normalized versus Renilla luciferase activity derived from a pRL-tk construct. Results are expressed as the means ± SDs of three independent experiments. * p < 0.05 and ** p < 0.01 vs. non-treated controls, # p < 0.05 vs. TM-treated cells. (d) INS-1 cells were pretreated with FMK (5, 10 or 20 μM) for 1 h, and then treated with TM for 9 h. Protein levels were measured by immunoblotting. The graph shows the densitometric quantification of western blot bands. Results are expressed as means ± SDs and are representative of three independent experiments. * p < 0.05 and ** p < 0.01 vs. non-treated controls. The asterisk indicates a non-specific band.

Similar articles

Cited by

References

    1. Cernea S., Dobreanu M. Diabetes and beta cell function: From mechanisms to evaluation and clinical implications. Biochem. Med. (Zagreb) 2013;23:266–280. doi: 10.11613/BM.2013.033. - DOI - PMC - PubMed
    1. Shao C., Gu J., Meng X., Zheng H., Wang D. Systematic investigation into the role of intermittent high glucose in pancreatic beta-cells. Int. J. Clin. Exp. Med. 2015;8:5462–5469. - PMC - PubMed
    1. Robertson R.P., Harmon J., Tran P.O., Poitout V. Beta-cell glucose toxicity, lipotoxicity, and chronic oxidative stress in type 2 diabetes. Diabetes. 2004;53(Suppl. 1):S119–S124. doi: 10.2337/diabetes.53.2007.S119. - DOI - PubMed
    1. Donath M.Y., Ehses J.A., Maedler K., Schumann D.M., Ellingsgaard H., Eppler E., Reinecke M. Mechanisms of beta-cell death in type 2 diabetes. Diabetes. 2005;54(Suppl. 2):S108–S113. doi: 10.2337/diabetes.54.suppl_2.S108. - DOI - PubMed
    1. Wang H., Kouri G., Wollheim C.B. Er stress and srebp-1 activation are implicated in beta-cell glucolipotoxicity. J. Cell Sci. 2005;118:3905–3915. doi: 10.1242/jcs.02513. - DOI - PubMed

MeSH terms

Substances

LinkOut - more resources