

Investigation of the Effect of PD-L1 Blockade on Triple Negative Breast Cancer Cells Using Fourier Transform Infrared Spectroscopy
- PMID: 31505846
- PMCID: PMC6789440
- DOI: 10.3390/vaccines7030109
Investigation of the Effect of PD-L1 Blockade on Triple Negative Breast Cancer Cells Using Fourier Transform Infrared Spectroscopy
Abstract
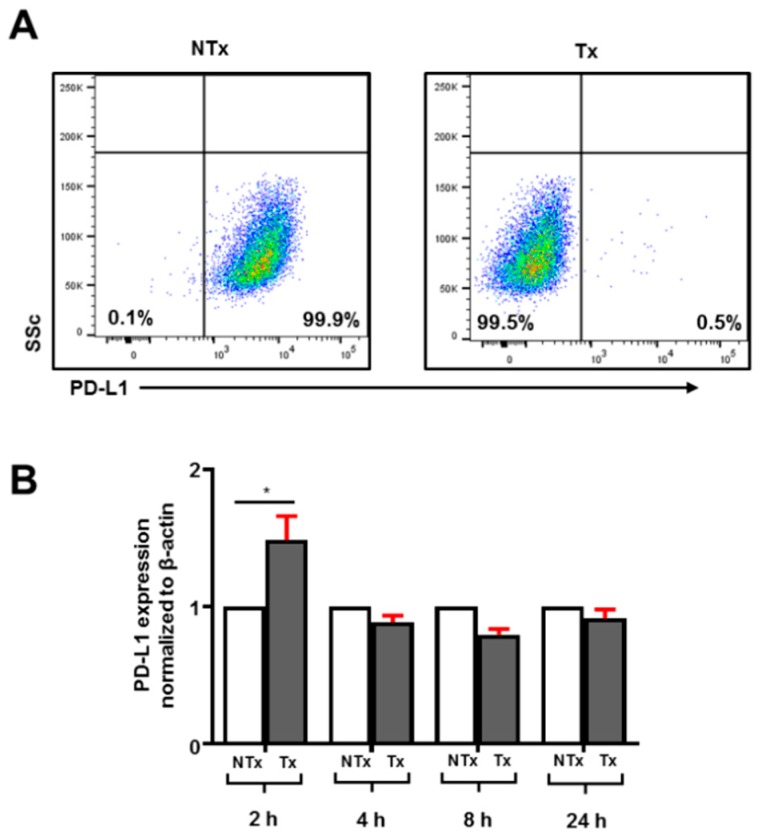
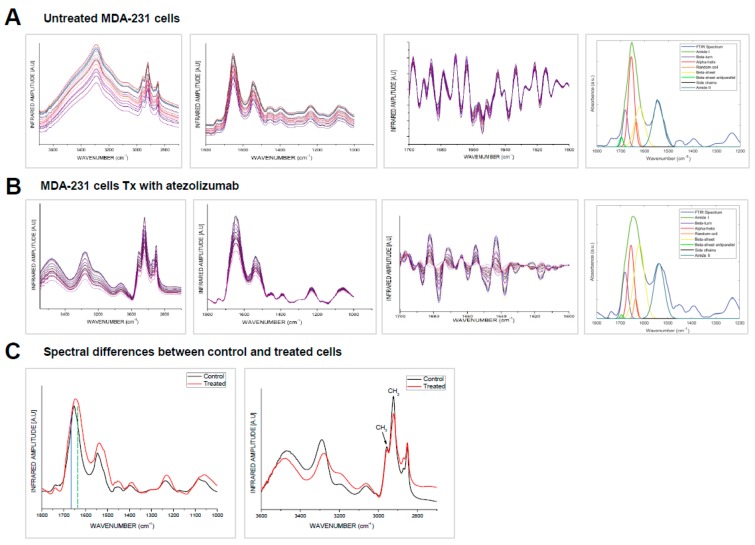
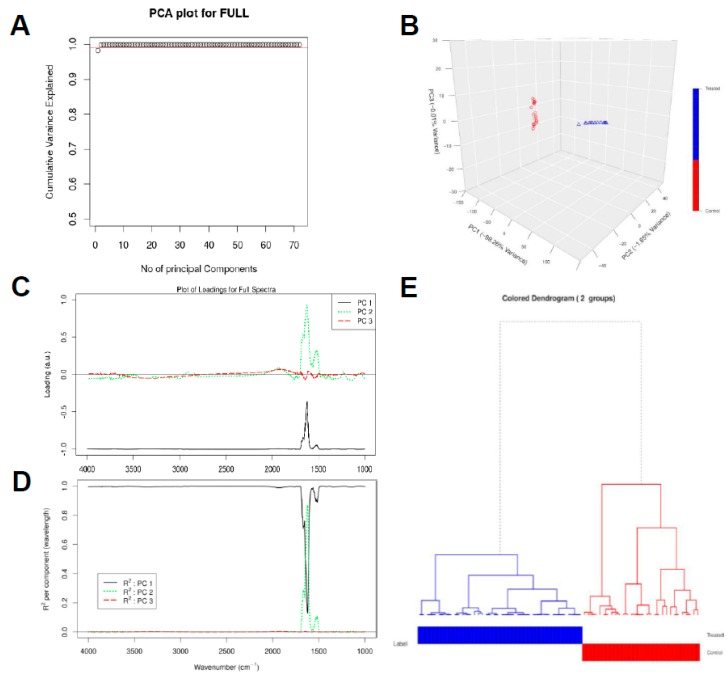
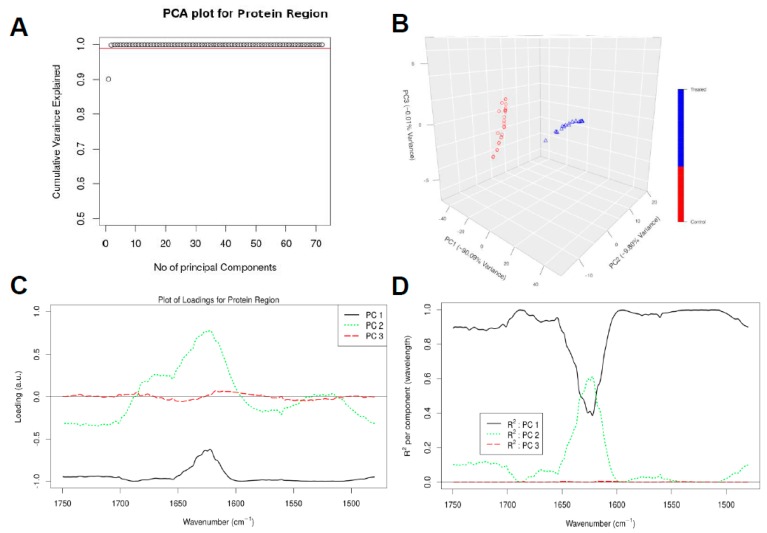
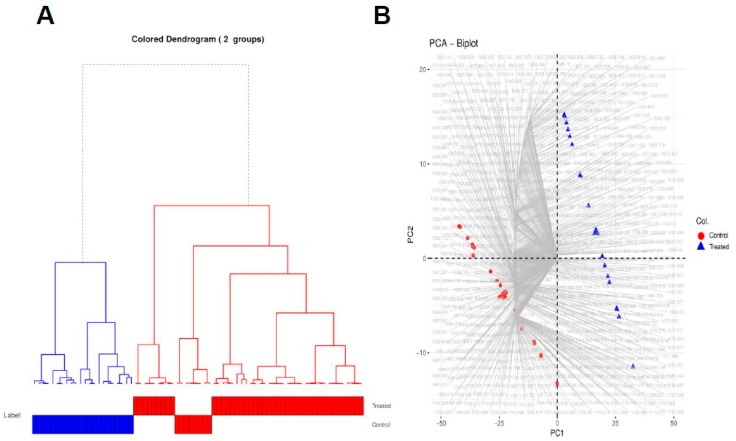
Interactions between programmed death-1 (PD-1) with its ligand PD-L1 on tumor cells can antagonize T cell responses. Inhibiting these interactions using immune checkpoint inhibitors has shown promise in cancer immunotherapy. MDA-MB-231 is a triple negative breast cancer cell line that expresses PD-L1. In this study, we investigated the biochemical changes in MDA-MB-231 cells following treatment with atezolizumab, a specific PD-L1 blocker. Our readouts were Fourier Transform Infrared (FTIR) spectroscopy and flow cytometric analyses. Chemometrical analysis, such as principal component analysis (PCA), was applied to delineate the spectral differences. We were able to identify the chemical alterations in both protein and lipid structure of the treated cells. We found that there was a shift from random coil and α-helical structure to β-sheet conformation of PD-L1 on tumor cells due to atezolizumab treatment, which could hinder binding with its receptors on immune cells, ensuring sustained T cell activation for potent immune responses. This work provides novel information about the effects of atezolizumab at molecular and cellular levels. FTIR bio-spectroscopy, in combination with chemometric analyses, may expedite research and offer new approaches for cancer immunology.
Keywords: FTIR; biochemical alterations; breast cancer; chemometric analysis; spectroscopy; tumor cells.
Conflict of interest statement
The authors declare no conflicts of interest.
Figures
Similar articles
-
PD-L1 Blockade by Atezolizumab Downregulates Signaling Pathways Associated with Tumor Growth, Metastasis, and Hypoxia in Human Triple Negative Breast Cancer.Cancers (Basel). 2019 Jul 25;11(8):1050. doi: 10.3390/cancers11081050. Cancers (Basel). 2019. PMID: 31349612 Free PMC article.
-
Effect of anthracycline and taxane on the expression of programmed cell death ligand-1 and galectin-9 in triple-negative breast cancer.Pathol Res Pract. 2018 Oct;214(10):1626-1631. doi: 10.1016/j.prp.2018.08.009. Epub 2018 Aug 17. Pathol Res Pract. 2018. PMID: 30139555
-
Breast Cancer Cells and PD-1/PD-L1 Blockade Upregulate the Expression of PD-1, CTLA-4, TIM-3 and LAG-3 Immune Checkpoints in CD4+ T Cells.Vaccines (Basel). 2019 Oct 12;7(4):149. doi: 10.3390/vaccines7040149. Vaccines (Basel). 2019. PMID: 31614877 Free PMC article.
-
Atezolizumab for the treatment of triple-negative breast cancer.Expert Opin Investig Drugs. 2019 Jan;28(1):1-5. doi: 10.1080/13543784.2019.1552255. Epub 2018 Dec 1. Expert Opin Investig Drugs. 2019. PMID: 30474425 Review.
-
Immunotherapy for the treatment of breast cancer: checkpoint blockade, cancer vaccines, and future directions in combination immunotherapy.Clin Adv Hematol Oncol. 2016 Nov;14(11):922-933. Clin Adv Hematol Oncol. 2016. PMID: 27930644 Review.
Cited by
-
Investigation of the Effect of Exendin-4 on Oleic Acid-Induced Steatosis in HepG2 Cells Using Fourier Transform Infrared Spectroscopy.Biomedicines. 2022 Oct 20;10(10):2652. doi: 10.3390/biomedicines10102652. Biomedicines. 2022. PMID: 36289914 Free PMC article.
-
Efficacy and safety of PD-1 and PD-L1 inhibitors combined with chemotherapy in randomized clinical trials among triple-negative breast cancer.Front Pharmacol. 2022 Sep 16;13:960323. doi: 10.3389/fphar.2022.960323. eCollection 2022. Front Pharmacol. 2022. PMID: 36188589 Free PMC article.
-
PD-L1 Blockade by Atezolizumab Downregulates Signaling Pathways Associated with Tumor Growth, Metastasis, and Hypoxia in Human Triple Negative Breast Cancer.Cancers (Basel). 2019 Jul 25;11(8):1050. doi: 10.3390/cancers11081050. Cancers (Basel). 2019. PMID: 31349612 Free PMC article.
-
Elucidating the multifaceted role of MGAT1 in hepatocellular carcinoma: integrative single-cell and spatial transcriptomics reveal novel therapeutic insights.Front Immunol. 2024 Jul 16;15:1442722. doi: 10.3389/fimmu.2024.1442722. eCollection 2024. Front Immunol. 2024. PMID: 39081317 Free PMC article.
-
Fourier Transform Infrared Imaging-A Novel Approach to Monitor Bio Molecular Changes in Subacute Mild Traumatic Brain Injury.Brain Sci. 2021 Jul 12;11(7):918. doi: 10.3390/brainsci11070918. Brain Sci. 2021. PMID: 34356152 Free PMC article.
References
LinkOut - more resources
Full Text Sources
Research Materials
Miscellaneous
