. 2019 Sep 9;20(18):4437.
doi: 10.3390/ijms20184437.

OsWRKY5 Promotes Rice Leaf Senescence via Senescence-Associated NAC and Abscisic Acid Biosynthesis Pathway

Affiliations

OsWRKY5 Promotes Rice Leaf Senescence via Senescence-Associated NAC and Abscisic Acid Biosynthesis Pathway

Taehoon Kim et al. Int J Mol Sci. .

Abstract

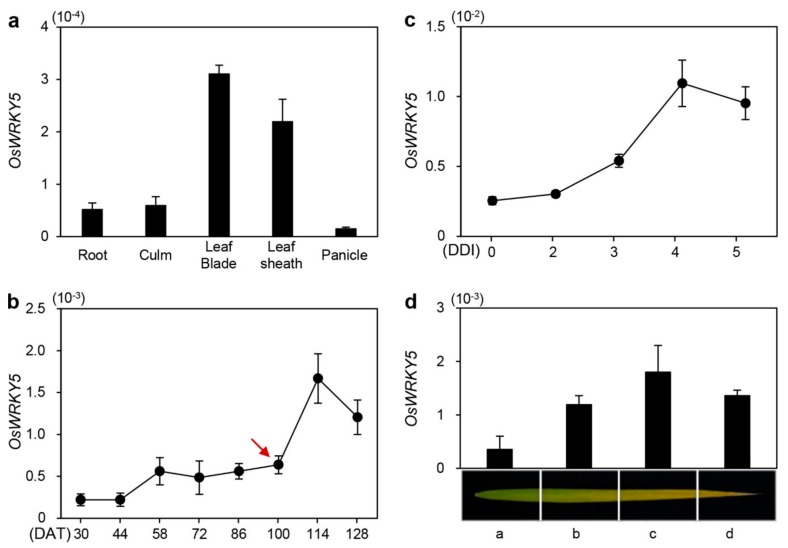
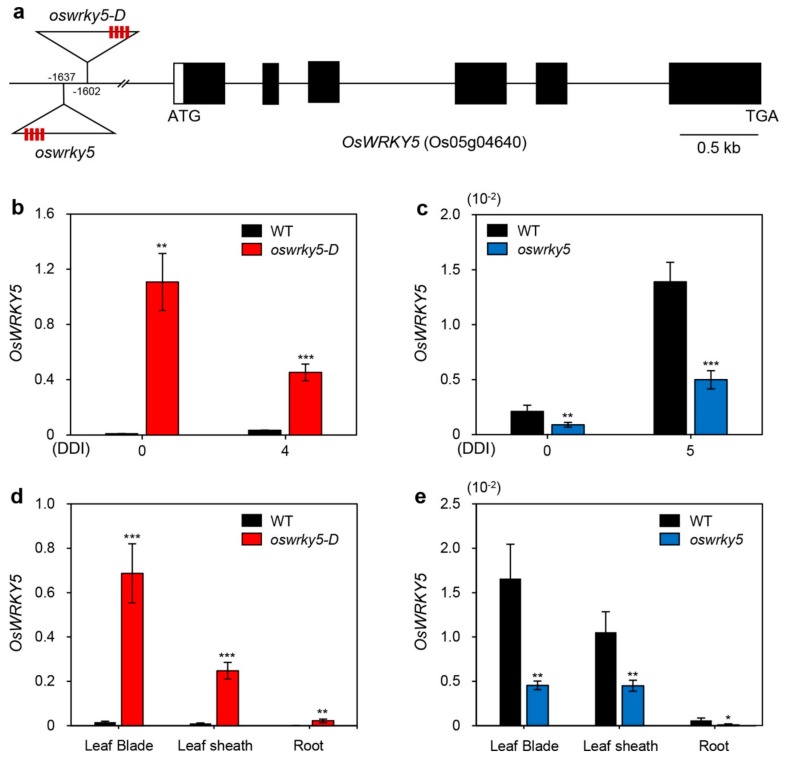
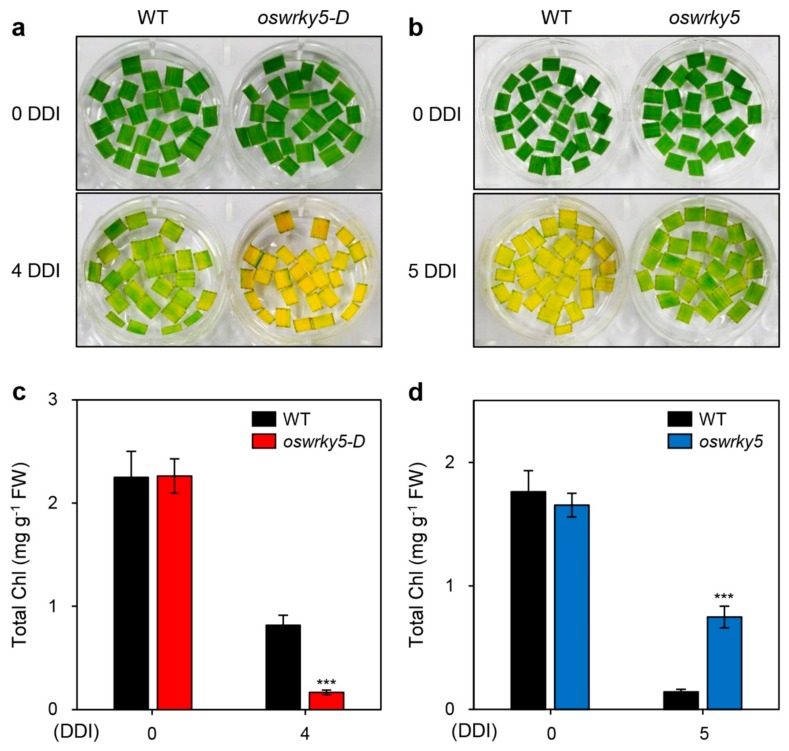
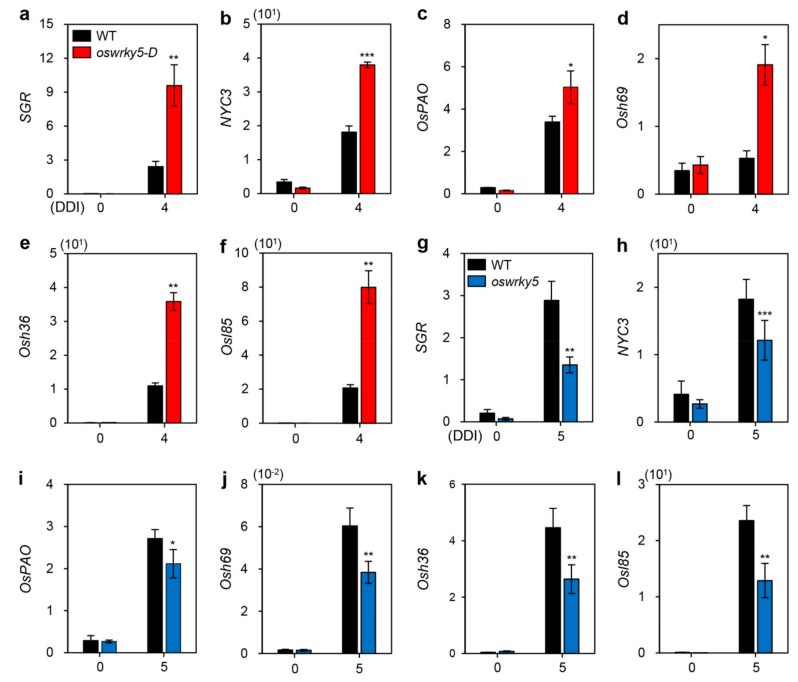
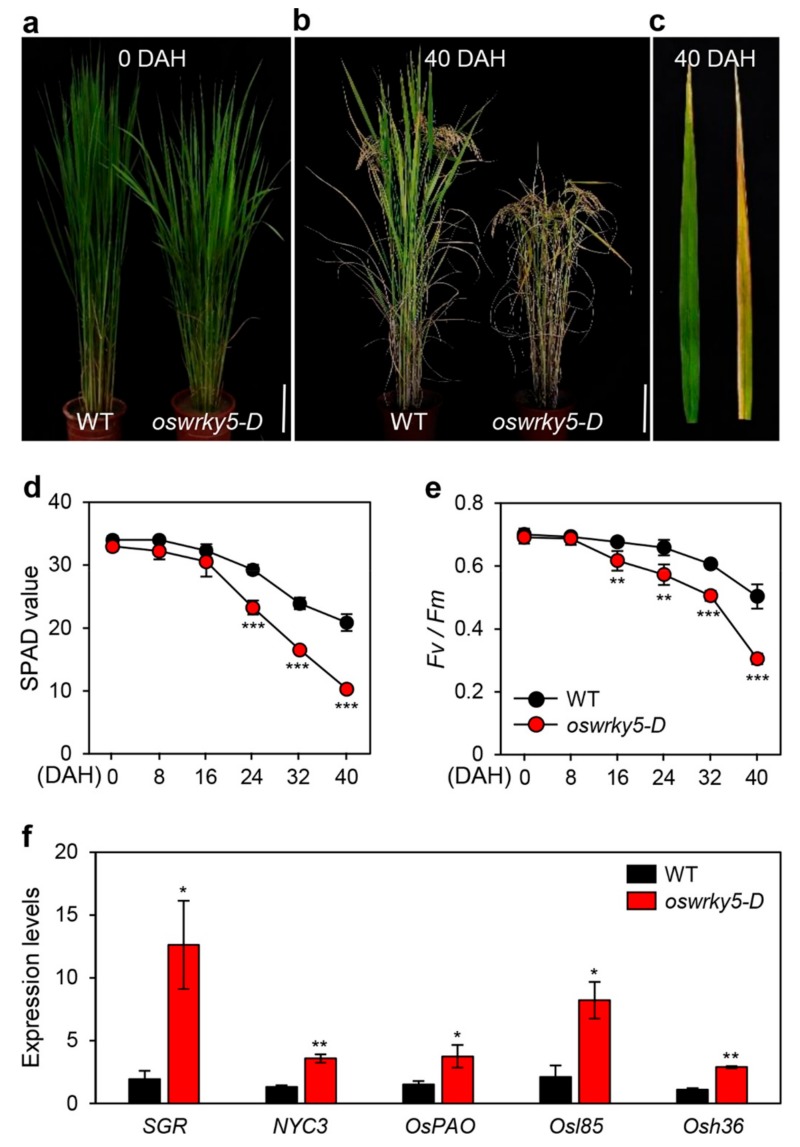
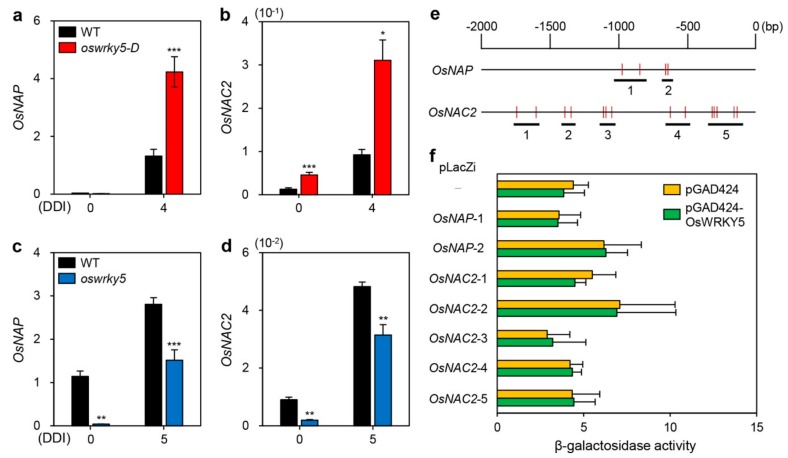
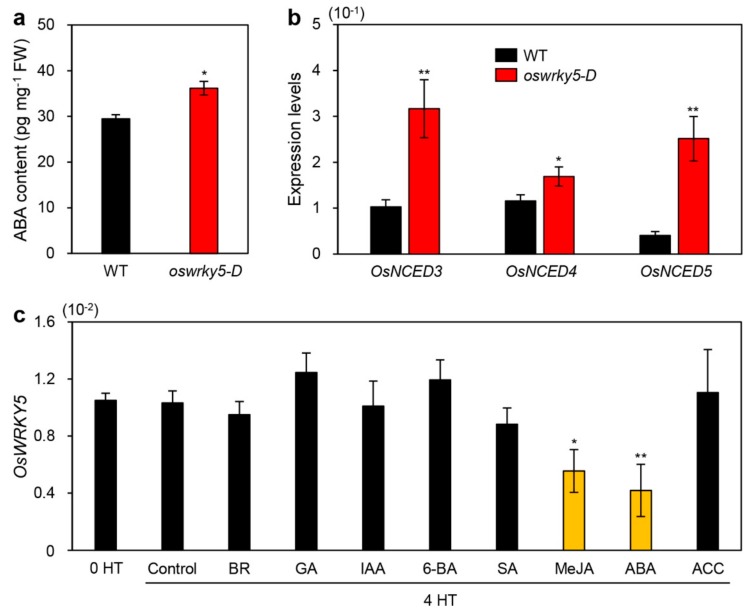
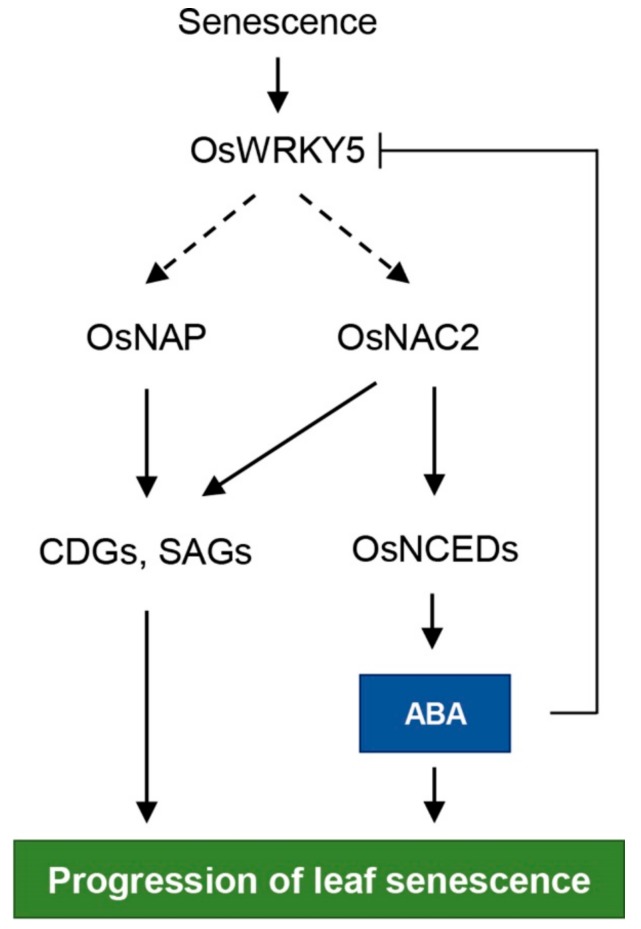
he onset of leaf senescence is triggered by external cues and internal factors such as phytohormones and signaling pathways involving transcription factors (TFs). Abscisic acid (ABA) strongly induces senescence and endogenous ABA levels are finely tuned by many senescence-associated TFs. Here, we report on the regulatory function of the senescence-induced TF OsWRKY5 TF in rice (Oryza sativa). OsWRKY5 expression was rapidly upregulated in senescing leaves, especially in yellowing sectors initiated by aging or dark treatment. A T-DNA insertion activation-tagged OsWRKY5-overexpressing mutant (termed oswrky5-D) promoted leaf senescence under natural and dark-induced senescence (DIS) conditions. By contrast, a T-DNA insertion oswrky5-knockdown mutant (termed oswrky5) retained leaf greenness during DIS. Reverse-transcription quantitative PCR (RT-qPCR) showed that OsWRKY5 upregulates the expression of genes controlling chlorophyll degradation and leaf senescence. Furthermore, RT-qPCR and yeast one-hybrid analysis demonstrated that OsWRKY5 indirectly upregulates the expression of senescence-associated NAM/ATAF1/2/CUC2 (NAC) genes including OsNAP and OsNAC2. Precocious leaf yellowing in the oswrky5-D mutant might be caused by elevated endogenous ABA concentrations resulting from upregulated expression of ABA biosynthesis genes OsNCED3, OsNCED4, and OsNCED5, indicating that OsWRKY is a positive regulator of ABA biosynthesis during leaf senescence. Furthermore, OsWRKY5 expression was suppressed by ABA treatment. Taken together, OsWRKY5 is a positive regulator of leaf senescence that upregulates senescence-induced NAC, ABA biosynthesis, and chlorophyll degradation genes.

Keywords: NAC; OsWRKY; abscisic acid (ABA); leaf senescence; rice.


Conflict of interest statement

The authors declare no conflict of interest.

Figures

Figure 1
Figure 1
Expression profiles of OsWRKY5 in rice. (a) OsWRKY5 mRNA levels in detached organs from the japonica cultivar ‘Dongjin’ (hereafter wild type; WT) at the heading stage. OsWRKY5 was mainly expressed in leaf blade and leaf sheath. (b,c) Changes in OsWRKY5 expression level in leaf blades of WT rice grown in a paddy field (b) or in the greenhouse (c) under natural long day conditions (≥14 h light/day). (c) Detached leaves of three-week-old WT were incubated in 3 Mm 2-(N-morpholino)ethanesulfonic (MES) buffer (pH 5.8) at 28 °C in complete darkness. Red arrow indicates heading date. (d) Expression of OsWRKY5 measured in flag leaves divided into four regions from the green sector (a) to the yellow sector (d) at 128 days after transplanting (DAT). OsWRKY5 mRNA levels were determined by RT-qPCR analysis and normalized to that of OsUBQ5 (Os01g22490). Mean and SD values were obtained from at least three biological samples. Experiments were repeated twice with similar results. DDI, day(s) of dark incubation.
Figure 2
Figure 2
Mutation of OsWRKY5 by T-DNA insertion. (a) Schematic diagram depicting the positions of T-DNA insertions in the promoter region of OsWRKY5 (LOC_Os05g04640). Black and white bars represent exons and 5′-untranslated region, respectively. Open triangles indicate the location of the OsWRKY5 T-DNA insertions (oswrky5-D, PFG_3A-15928; oswrky5, PFG_3A-06060). Red boxes on triangles represent tetramerized 35S enhancers (4 × 35S). (b,c) Total RNA was isolated from detached leaves of WT and mutant lines (oswrky5-D and oswrky5) under DIS as shown in Figure 3a,b. (d,e) OsWRKY5 mRNA levels were measured in rice tissues separated from three-week-old WT and mutant lines. Transcript levels of OsWRKY5 in oswrky5-D (b,d) and oswrky5 (c,e) were determined by RT-qPCR and normalized to the transcript levels of OsUBQ5. Mean and SD values were obtained from more than three biological replicates. Asterisks indicate a statistically significant difference from WT, as determined by Student’s t-test (* p < 0.05, ** p < 0.01, *** p < 0.001). DDI, day(s) of dark incubation.
Figure 3
Figure 3
OsWRKY5 promotes leaf yellowing under dark-induced senescence (DIS) conditions. WT and mutant lines (oswrky5-D and oswrky5) were grown in paddy soil for four weeks under natural long day conditions (≥14 h light/day). (a,b) Yellowing of detached leaves induced in 3 mM MES buffer (pH 5.8) at 28 °C under complete darkness. Changes in leaf color (a,b) and total chlorophyll (Chl) contents (c,d) of oswrky5-D or oswrky5 mutants compared with the WT after 4 or 5 days of dark incubation (DDI), respectively. Mean and SD values were obtained from more than three biological replicates. Asterisks indicate a statistically significant difference from WT, as determined by Student’s t-test (*** p < 0.001). Experiments were repeated twice with similar results. FW, fresh weight.
Figure 4
Figure 4
Altered expression of CDGs and SAGs in oswrky5-D and oswrky5 during DIS. Total RNA was isolated from detached leaves of WT and mutant lines (oswrky5-D and oswrky5) under DIS as shown in Figure 3 (3a,b). Expression of CDGs and SAGs in oswrky5-D (af) or oswrky5 (gl) was compared with that in the WT after 4 or 5 DDI, respectively. Transcript levels of CDGs (ac and gi) and SAGs (df and jl) were determined by RT-qPCR analysis and normalized to that of OsUBQ5. Mean and SD values were obtained from more than three biological replicates. Asterisks indicate a statistically significant difference from WT, as determined by Student’s t-test (* p < 0.05, ** p < 0.01, *** p < 0.001). Experiments were repeated twice with similar results. CDGs, Chl degradation genes; DDI, day(s) of dark incubation; SAGs, senescence-associated genes.
Figure 5
Figure 5
oswrky5-D promotes leaf senescence during NS. WT and oswrky5-D plants were grown in a paddy field under natural long-day conditions (≥14 h light/day). (a,b) Phenotypes of WT and oswrky5-D plants at heading (0 DAH) (a) and 40 days after heading (DAH) (b). White scale bars = 20 cm. (c) Senescing flag leaves of WT (left) and oswrky5-D (right) at 40 DAH. Photos shown are representative of five independent plants. (de) Changes in SPAD value (d) and photosystem II (PSII) activity (Fv/Fm) (e) in flag leaves at heading. (f) Expression of CDGs and SAGs measured in senescing flag leaves (c). Transcript levels were determined by RT-qPCR analysis and normalized to that of OsUBQ5. Mean and SD values were obtained from more than three biological replicates. Asterisks indicate a statistically significant difference from WT, as determined by Student’s t-test (* p < 0.05, ** p < 0.01, *** p < 0.001).
Figure 6
Figure 6
OsWRKY5 indirectly regulates expression of senescence-induced NAC TFs. (ad) Total RNA was isolated from detached leaves of WT and mutant lines (oswrky5-D and oswrky5), as shown in Figure 3 (a,b). Transcript levels of OsNAP (a,c) and OsNAC2 (b,d) were determined by RT-qPCR analysis and normalized to the transcript levels of OsUBQ5. Mean and SD values were obtained from more than three biological replicates. Asterisks indicate a statistically significant difference from WT, as determined by Student’s t-test (* p < 0.05, ** p < 0.01, *** p < 0.001). (e,f) Interaction of OsWRKY5 with the promoters of OsNAP and OsNAC2 by yeast one-hybrid assays. (e) Numbers represent upstream base pairs from the transcriptional initiation sites of OsNAP and OsNAC2. Vertical red lines represent the W-box core sequence (TGAC). Horizontal black bars represent regions containing repetitive TGAC sequences. (f) β-Galactosidase activity of bait plasmids (pGAD424 and pGAD424-OsWRKY5) evaluated by the absorbance of chloramphenicol red, a hydrolysis product of chlorophenol red-β-D-galactopyranoside (CPRG). Empty bait (pGAD424) and prey plasmids (-) were used for negative controls. Experiments were repeated twice with similar results. DDI, day(s) of dark incubation.
Figure 7
Figure 7
OsWRKY5 participates in ABA-mediated senescence pathways. (a) Endogenous ABA contents measured in leaves of WT and oswrky5-D plants grown in paddy soil for 3 weeks under LD conditions. FW, fresh weight. (b) Total RNA was extracted from leaves of the same WT and oswrky5-D plants used for the analysis shown in Figure 6A. Transcript levels of ABA biosynthetic genes including OsNCED3, OsNCED4, and OsNCED5 were determined by RT-qPCR analysis and normalized to transcript levels of OsUBQ5. Mean and SD values were obtained from more than three biological replicates. Asterisks indicate a statistically significant difference from WT, as determined by Student’s t-test (* p < 0.05, ** p < 0.01). (c) Ten-day-old WT seedlings grown on 0.5X MS phytoagar medium at 28 °C under continuous light conditions were transferred to 0.5X MS liquid medium only (control) or 0.5X MS liquid medium containing 50 μM epibrassinolide (BR), 50 μM gibberellic acid (GA), 50 μM 3-indoleacetic acid (IAA), 50 μM 6-benzylaminopurine (6-BA), 100 μM salicylic acid (SA), 50 μM methyl jasmonic acid (MeJA), 50 μM abscisic acid (ABA), or 50 μM 1-aminocyclopropane-1-carboxylic acid (ACC). Total RNA was isolated from leaves after 4 h of treatment. OsWRKY5 mRNA levels were determined by RT-qPCR analysis and normalized to transcript levels of OsUBQ5. Mean and SD values were obtained from more than three biological replicates. Asterisks on orange bars indicate a statistically significant difference from the control, as determined by Student’s t-test (*p < 0.05, ** p < 0.01). Experiments were repeated twice with similar results.
Figure 8
Figure 8
Proposed model for the role of OsWRKY5 in leaf senescence. Arrows indicate activation and bar-ended line represents inhibition. Solid and dashed arrows represent direct and indirect regulation, respectively.

Similar articles

Cited by

References

    1. Guo Y., Gan S. Leaf senescence: Signals, execution, and regulation. Curr. Top. Dev. Biol. 2005;71:83–112. - PubMed
    1. Lim P.O., Kim H.J., Nam H.G. Leaf senescence. Annu. Rev. Plant Biol. 2007;58:115–136. doi: 10.1146/annurev.arplant.57.032905.105316. - DOI - PubMed
    1. Liu L., Zhou Y., Zhou G., Ye R., Zhao L., Li X., Lin Y. Identification of early senescence-associated genes in rice flag leaves. Plant Mol. Biol. 2008;67:37–55. doi: 10.1007/s11103-008-9300-1. - DOI - PubMed
    1. Park S.-Y., Yu J.-W., Park J.-S., Li J., Yoo S.-C., Lee N.-Y., Lee S.-K., Jeong S.-W., Seo H.S., Koh H.-J., et al. The senescence-induced staygreen protein regulates chlorophyll degradation. Plant Cell. 2007;19:1649–1664. doi: 10.1105/tpc.106.044891. - DOI - PMC - PubMed
    1. Shimoda Y., Ito H., Tanaka A. Arabidopsis STAY-GREEN, Mendel’s green cotyledon gene, encodes magnesium-dechelatase. Plant Cell. 2016;28:2147–2160. doi: 10.1105/tpc.16.00428. - DOI - PMC - PubMed

MeSH terms

LinkOut - more resources