

In Vitro and In Silico Mechanistic Insights into miR-21-5p-Mediated Topoisomerase Drug Resistance in Human Colorectal Cancer Cells
- PMID: 31505885
- PMCID: PMC6769444
- DOI: 10.3390/biom9090467
In Vitro and In Silico Mechanistic Insights into miR-21-5p-Mediated Topoisomerase Drug Resistance in Human Colorectal Cancer Cells
Abstract
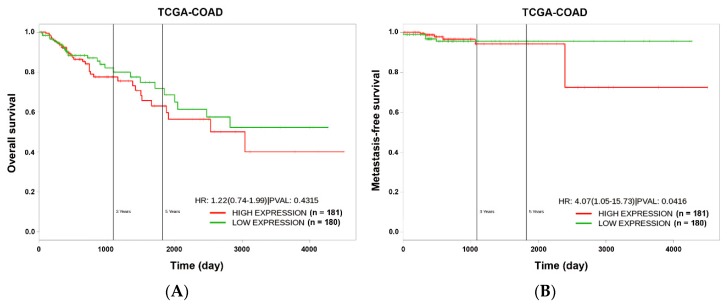
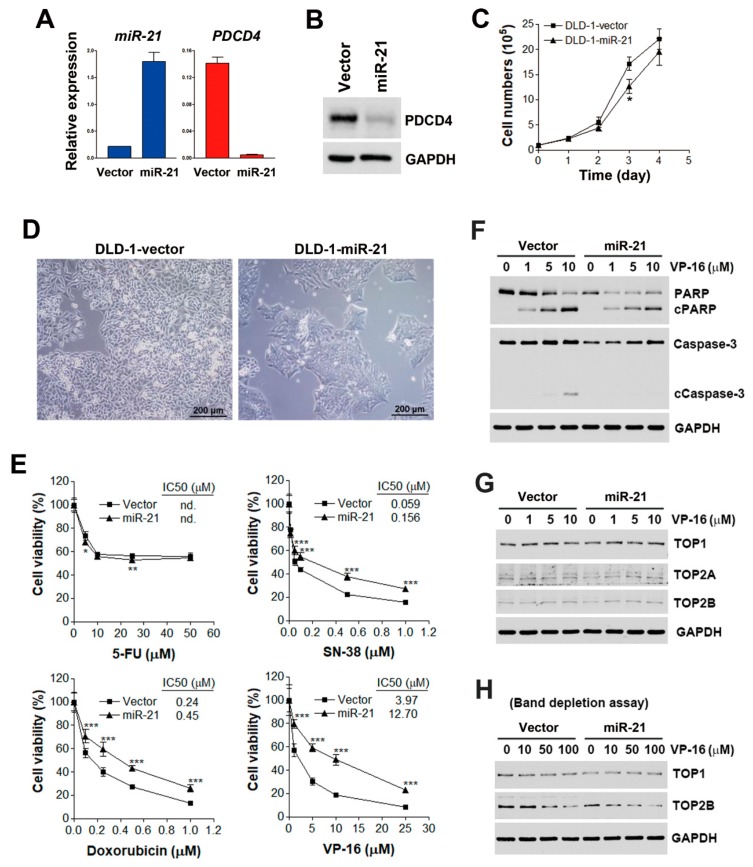
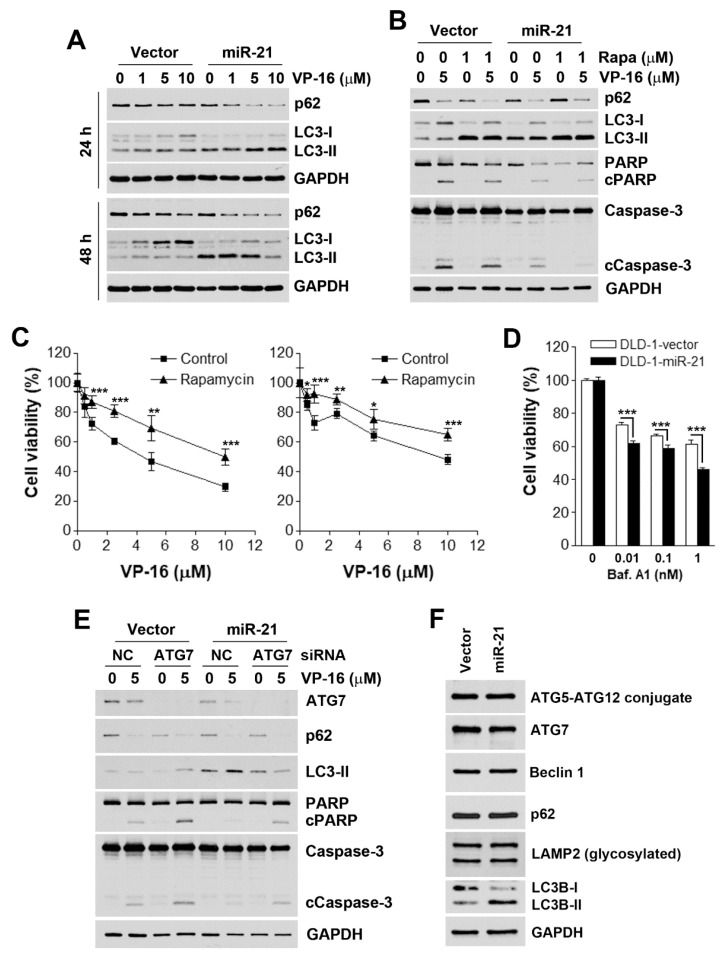
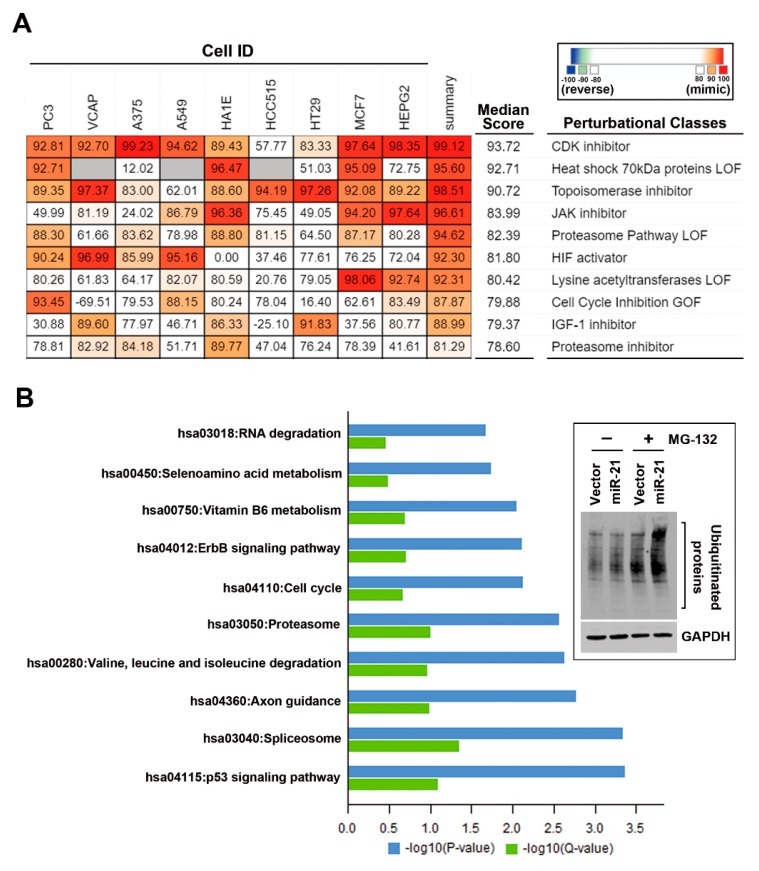
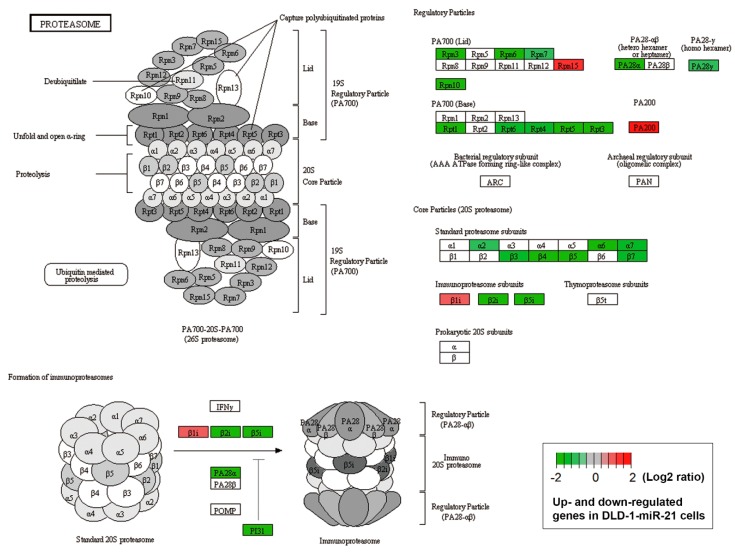
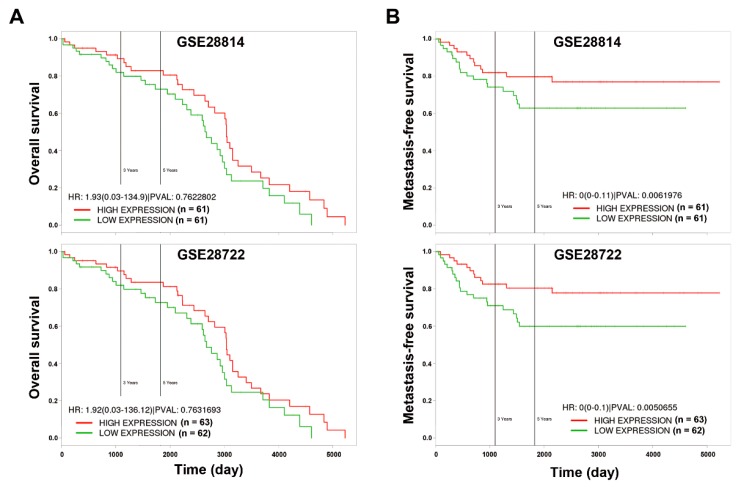
Although chemotherapy for treating colorectal cancer has had some success, drug resistance and metastasis remain the major causes of death for colorectal cancer patients. MicroRNA-21-5p (hereafter denoted as miR-21) is one of the most abundant miRNAs in human colorectal cancer. A Kaplan-Meier survival analysis found a negative prognostic correlation of miR-21 and metastasis-free survival in colorectal cancer patients (The Cancer Genome Atlas Colon Adenocarcinoma/TCGA-COAD cohort). To explore the role of miR-21 overexpression in drug resistance, a stable miR-21-overexpressing clone in a human DLD-1 colorectal cancer cell line was established. The 3-(4,5-dimethylthiazol-2-yl)-2,5-diphenyl tetrazolium bromide (MTT) cell viability assay found that miR-21 overexpression induced drug resistance to topoisomerase inhibitors (SN-38, doxorubicin, and etoposide/VP-16). Mechanistically, we showed that miR-21 overexpression reduced VP-16-induced apoptosis and concomitantly enhanced pro-survival autophagic flux without the alteration of topoisomerase expression and activity. Bioinformatics analyses suggested that miR-21 overexpression induced genetic reprogramming that mimicked the gene signature of topoisomerase inhibitors and downregulated genes related to the proteasome pathway. Taken together, our results provide a novel insight into the role of miR-21 in the development of drug resistance in colorectal cancer.
Keywords: Connectivity Map; autophagy; colorectal cancer; drug resistance; microRNA.
Conflict of interest statement
The authors declare no conflict of interest.
Figures
Similar articles
-
Modified TLR-mediated downregulation of miR-125b-5p enhances CD248 (endosialin)-induced metastasis and drug resistance in colorectal cancer cells.Mol Carcinog. 2020 Feb;59(2):154-167. doi: 10.1002/mc.23137. Epub 2019 Nov 19. Mol Carcinog. 2020. PMID: 31746054
-
GDPD5, a target of miR-195-5p, is associated with metastasis and chemoresistance in colorectal cancer.Biomed Pharmacother. 2018 May;101:945-952. doi: 10.1016/j.biopha.2018.03.028. Epub 2018 Mar 22. Biomed Pharmacother. 2018. PMID: 29635904
-
miR-204-5p inhibits proliferation and invasion and enhances chemotherapeutic sensitivity of colorectal cancer cells by downregulating RAB22A.Clin Cancer Res. 2014 Dec 1;20(23):6187-99. doi: 10.1158/1078-0432.CCR-14-1030. Epub 2014 Oct 7. Clin Cancer Res. 2014. PMID: 25294901
-
MicroRNA-10b is a prognostic indicator in colorectal cancer and confers resistance to the chemotherapeutic agent 5-fluorouracil in colorectal cancer cells.Ann Surg Oncol. 2012 Sep;19(9):3065-71. doi: 10.1245/s10434-012-2246-1. Epub 2012 Feb 10. Ann Surg Oncol. 2012. PMID: 22322955
-
The long non-coding RNA HOTAIRM1 suppresses cell progression via sponging endogenous miR-17-5p/ B-cell translocation gene 3 (BTG3) axis in 5-fluorouracil resistant colorectal cancer cells.Biomed Pharmacother. 2019 Sep;117:109171. doi: 10.1016/j.biopha.2019.109171. Epub 2019 Jun 29. Biomed Pharmacother. 2019. PMID: 31261026
Cited by
-
Safety and long-term prognosis of simultaneous versus staged resection in synchronous colorectal cancer with liver metastasis: a systematic review and meta-analysis.Eur J Med Res. 2022 Dec 19;27(1):297. doi: 10.1186/s40001-022-00937-z. Eur J Med Res. 2022. PMID: 36529740 Free PMC article.
-
Fuzheng Kang' ai decoction inhibits cell proliferation, migration and invasion by modulating mir-21-5p/human phosphatase and tensin homology deleted on chromosome ten in lung cancer cells.J Tradit Chin Med. 2022 Jun;42(3):344-352. doi: 10.19852/j.cnki.jtcm.2022.03.003. J Tradit Chin Med. 2022. PMID: 35610003 Free PMC article.
-
Heterobasidion annosum Induces Apoptosis in DLD-1 Cells and Decreases Colon Cancer Growth in In Vivo Model.Int J Mol Sci. 2020 May 13;21(10):3447. doi: 10.3390/ijms21103447. Int J Mol Sci. 2020. PMID: 32414138 Free PMC article.
-
MiR-1254 and MEGF6 regulates oxaliplatin resistance in human colorectal cancer cells.Am J Transl Res. 2021 Jan 15;13(1):183-196. eCollection 2021. Am J Transl Res. 2021. PMID: 33527017 Free PMC article.
-
MiR-21 in the Cancers of the Digestive System and Its Potential Role as a Diagnostic, Predictive, and Therapeutic Biomarker.Biology (Basel). 2021 May 8;10(5):417. doi: 10.3390/biology10050417. Biology (Basel). 2021. PMID: 34066762 Free PMC article. Review.
References
-
- Volinia S., Calin G.A., Liu C.G., Ambs S., Cimmino A., Petrocca F., Visone R., Iorio M., Roldo C., Ferracin M., et al. A microRNA expression signature of human solid tumors defines cancer gene targets. Proc. Natl. Acad. Sci. USA. 2006;103:2257–2261. doi: 10.1073/pnas.0510565103. - DOI - PMC - PubMed
Publication types
MeSH terms
Substances
LinkOut - more resources
Full Text Sources
Medical
Molecular Biology Databases
Research Materials
Miscellaneous
