

Metabolomic analysis of date palm seedlings exposed to salinity and silicon treatments
- PMID: 31505987
- PMCID: PMC6804709
- DOI: 10.1080/15592324.2019.1663112
Metabolomic analysis of date palm seedlings exposed to salinity and silicon treatments
Abstract
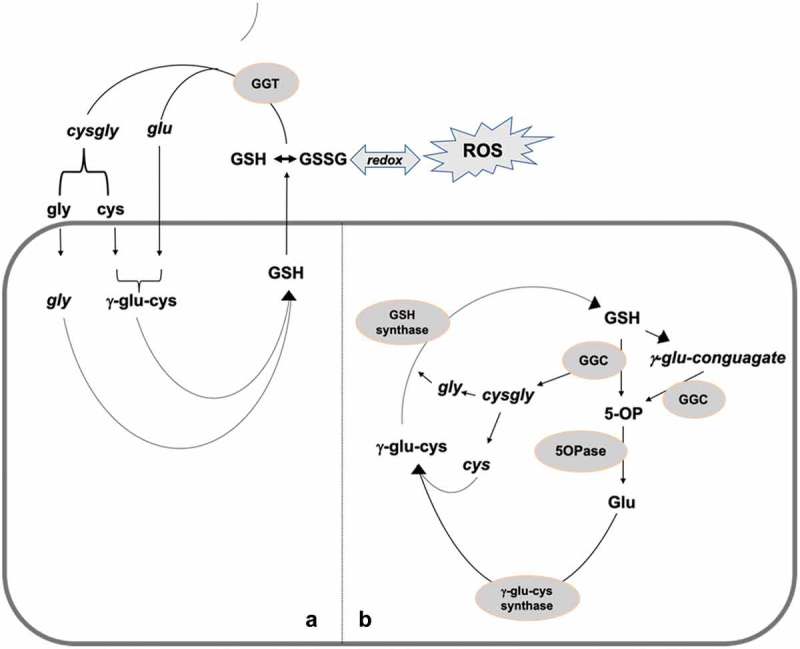
Silicon is known to promote plant growth as well as stress tolerance of plants. The current study was undertaken to assess the growth promoting effect of silicon on date palm seedling development as well as its ability to abate some of the negative effects of salinity. In this study, date palm seedlings were treated with silicon and sodium chloride salts, and the effect of these salts on some physiological parameters of the plants was determined. In addition, a global nontargeted metabolomics analysis was performed for the leaf and root tissues using liquid chromatography-mass spectrometry (LC-MS). The results showed that under non-stress conditions, silicon treatment enhanced the growth of the date palm seedlings, however, under salinity, silicon slightly mitigates the negative effects of salt stress on the date palm seedlings although it enhances the potassium accumulation under this condition. The global metabolomics analysis has identified a total of 1,101 significant differentially accumulated (p, q ≤ 0.05) metabolites in leaves and roots under silicon, salinity or their combination. A differential pairwise metabolic profile comparison revealed the accumulation of distinct metabolites in response to silicon and salinity treatments such as antioxidant compounds pyridoxine, cepharanthine, allithiamine, myristic acid and boldine; osmoregulators such as mucic acid; along with the accumulation of detoxification intermediates such as S-D-lactoylglutathione, beta-cyano-L-alanine and gamma-glutamyl-conjugates. In addition, histochemical analyses revealed that application of silicon significantly (p ≤ 0.05) enhanced the formation of the Casparian strip. Identification of the differentially accumulated metabolites could offer an insight into how silicon is able to promote growth and salinity tolerance in date palms.
Keywords: Salinity; antioxidants; date palm; detoxification; metabolomics; silicon; tolerance.
Figures


Similar articles
-
Silicon-mediated alleviation of combined salinity and cadmium stress in date palm (Phoenix dactylifera L.) by regulating physio-hormonal alteration.Ecotoxicol Environ Saf. 2020 Jan 30;188:109885. doi: 10.1016/j.ecoenv.2019.109885. Epub 2019 Nov 5. Ecotoxicol Environ Saf. 2020. PMID: 31704322
-
Genome-wide expression profiling in leaves and roots of date palm (Phoenix dactylifera L.) exposed to salinity.BMC Genomics. 2017 Mar 22;18(1):246. doi: 10.1186/s12864-017-3633-6. BMC Genomics. 2017. PMID: 28330456 Free PMC article.
-
Endophytic fungi are able to induce tolerance to salt stress in date palm seedlings (Phoenix dactylifera L.).Braz J Microbiol. 2024 Mar;55(1):759-775. doi: 10.1007/s42770-023-01216-7. Epub 2023 Dec 29. Braz J Microbiol. 2024. PMID: 38157149 Free PMC article.
-
Proteome of Abiotic Stress Tolerance in Date Palm.Methods Mol Biol. 2017;1638:355-363. doi: 10.1007/978-1-4939-7159-6_26. Methods Mol Biol. 2017. PMID: 28755234
-
Fascinating role of silicon to combat salinity stress in plants: An updated overview.Plant Physiol Biochem. 2021 May;162:110-123. doi: 10.1016/j.plaphy.2021.02.023. Epub 2021 Feb 25. Plant Physiol Biochem. 2021. PMID: 33667964 Review.
Cited by
-
Salt Stress Modulates the Landscape of Transcriptome and Alternative Splicing in Date Palm (Phoenix dactylifera L.).Front Plant Sci. 2022 Jan 20;12:807739. doi: 10.3389/fpls.2021.807739. eCollection 2021. Front Plant Sci. 2022. PMID: 35126432 Free PMC article.
-
Is Silicon a Panacea for Alleviating Drought and Salt Stress in Crops?Front Plant Sci. 2020 Aug 18;11:1221. doi: 10.3389/fpls.2020.01221. eCollection 2020. Front Plant Sci. 2020. PMID: 32973824 Free PMC article.
-
Evaluation of morphological traits of wheat varieties at germination stage under salinity stress.PLoS One. 2021 Nov 4;16(11):e0258703. doi: 10.1371/journal.pone.0258703. eCollection 2021. PLoS One. 2021. Retraction in: PLoS One. 2022 Aug 31;17(8):e0273462. doi: 10.1371/journal.pone.0273462. PMID: 34735471 Free PMC article. Retracted.
-
Multidimensional Role of Silicon to Activate Resilient Plant Growth and to Mitigate Abiotic Stress.Front Plant Sci. 2022 Mar 23;13:819658. doi: 10.3389/fpls.2022.819658. eCollection 2022. Front Plant Sci. 2022. PMID: 35401625 Free PMC article. Review.
-
The Physiological and Molecular Mechanisms of Silicon Action in Salt Stress Amelioration.Plants (Basel). 2024 Feb 15;13(4):525. doi: 10.3390/plants13040525. Plants (Basel). 2024. PMID: 38498577 Free PMC article. Review.
References
-
- Jamil A, Riaz S, Ashraf M, Foolad M.. Gene expression profiling of plants under salt stress. CRC Crit Rev Plant Sci. 2011;30:1–16. doi:10.1080/07352689.2011.605739. - DOI
-
- Imtiaz M, Rizwan MS, Mushtaq MA, Ashraf M, Shahzad SM, Yousaf B, Saeed DA, Rizwan M, Nawaz MA, Mehmood S. Silicon occurrence, uptake, transport and mechanisms of heavy metals, minerals and salinity enhanced tolerance in plants with future prospects: a review. J Environ Manage. 2016;183:521–529. doi:10.1016/j.jenvman.2016.09.009. - DOI - PubMed
Publication types
MeSH terms
Substances
LinkOut - more resources
Full Text Sources
Other Literature Sources
Miscellaneous