

Valence of social information is encoded in different subpopulations of mushroom body Kenyon cells in the honeybee brain
- PMID: 31506059
- PMCID: PMC6743001
- DOI: 10.1098/rspb.2019.0901
Valence of social information is encoded in different subpopulations of mushroom body Kenyon cells in the honeybee brain
Abstract
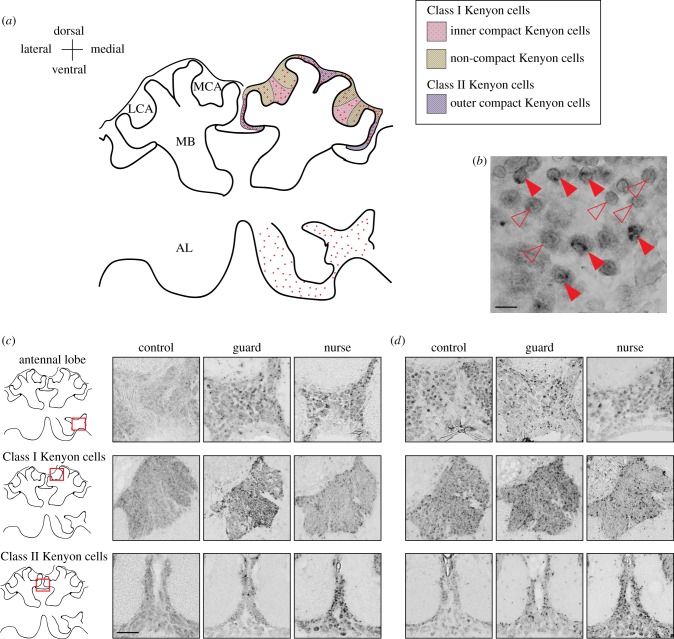
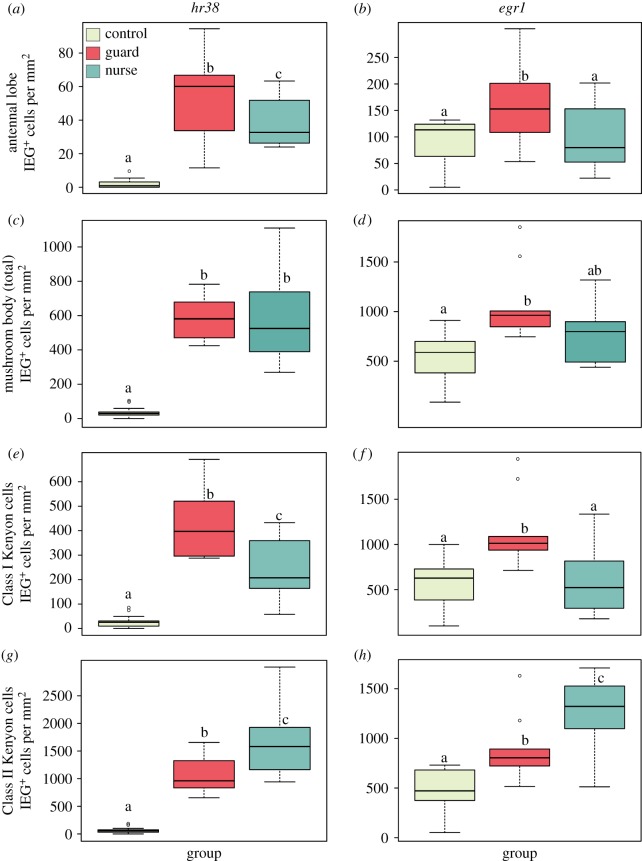
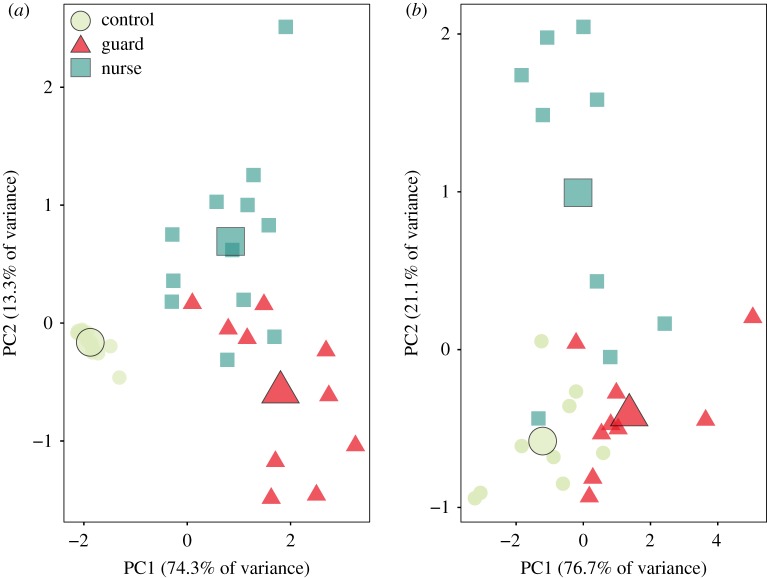
Over 600 Myr of evolutionary divergence between vertebrates and invertebrates is associated with considerable neuroanatomical variation both across and within these lineages. By contrast, valence encoding is an important behavioural trait that is evolutionarily conserved across vertebrates and invertebrates, and enables individuals to distinguish between positive (potentially beneficial) and negative (potentially harmful) situations. We tested the hypothesis that social interactions of positive and negative valence are modularly encoded in the honeybee brain (i.e. encoded in different cellular subpopulations) as in vertebrate brains. In vertebrates, neural activation patterns are distributed across distinct parts of the brain, suggesting that discrete circuits encode positive or negative stimuli. Evidence for this hypothesis would suggest a deep homology of neural organization between insects and vertebrates for valence encoding, despite vastly different brain sizes. Alternatively, overlapping localization of valenced social information in the brain would imply a 're-use' of circuitry in response to positive and negative social contexts, potentially to overcome the energetic constraints of a tiny brain. We used immediate early gene expression to map positively and negatively valenced social interactions in the brain of the western honeybee Apis mellifera. We found that the valence of a social signal is represented by distinct anatomical subregions of the mushroom bodies, an invertebrate sensory neuropil associated with social behaviour, multimodal sensory integration, learning and memory. Our results suggest that the modularization of valenced social information in the brain is a fundamental property of neuroanatomical organization.
Keywords: behavioural neurobiology; brain evolution; immediate early genes; neurogenomics; social behaviour; valence encoding.
Conflict of interest statement
We declare we have no competing interests.
Figures

Similar articles
-
The insect mushroom body, an experience-dependent recoding device.J Physiol Paris. 2014 Apr-Jun;108(2-3):84-95. doi: 10.1016/j.jphysparis.2014.07.004. Epub 2014 Aug 1. J Physiol Paris. 2014. PMID: 25092259
-
Parasitoidism, not sociality, is associated with the evolution of elaborate mushroom bodies in the brains of hymenopteran insects.Proc Biol Sci. 2011 Mar 22;278(1707):940-51. doi: 10.1098/rspb.2010.2161. Epub 2010 Nov 10. Proc Biol Sci. 2011. PMID: 21068044 Free PMC article.
-
[The morphological basis of conditioned reflex in the honeybee Apis mellifera L].Zh Vyssh Nerv Deiat Im I P Pavlova. 2012 Nov-Dec;62(6):654-63. Zh Vyssh Nerv Deiat Im I P Pavlova. 2012. PMID: 23530444 Review. Russian.
-
Expansion microscopy in honeybee brains for high-resolution neuroanatomical analyses in social insects.Cell Tissue Res. 2023 Sep;393(3):489-506. doi: 10.1007/s00441-023-03803-4. Epub 2023 Jul 8. Cell Tissue Res. 2023. PMID: 37421435 Free PMC article.
-
Second messenger pathways in the honeybee brain: immunohistochemistry of protein kinase A and protein kinase C.Microsc Res Tech. 1999 May 1;45(3):165-73. doi: 10.1002/(sici)1097-0029(19990501)45:3<165::aid-jemt4>3.3.co;2-q. Microsc Res Tech. 1999. PMID: 10344768 Review.
Cited by
-
Parallel mechanisms of visual memory formation across distinct regions of the honey bee brain.J Exp Biol. 2021 Oct 1;224(19):jeb242292. doi: 10.1242/jeb.242292. Epub 2021 Oct 8. J Exp Biol. 2021. PMID: 34515309 Free PMC article.
-
Shore crabs reveal novel evolutionary attributes of the mushroom body.Elife. 2021 Feb 9;10:e65167. doi: 10.7554/eLife.65167. Elife. 2021. PMID: 33559601 Free PMC article.
-
Context-dependent influence of threat on honey bee social network dynamics and brain gene expression.J Exp Biol. 2022 Mar 15;225(6):jeb243738. doi: 10.1242/jeb.243738. Epub 2022 Mar 28. J Exp Biol. 2022. PMID: 35202460 Free PMC article.
-
Analysis of Synaptic Microcircuits in the Mushroom Bodies of the Honeybee.Insects. 2020 Jan 7;11(1):43. doi: 10.3390/insects11010043. Insects. 2020. PMID: 31936165 Free PMC article. Review.
-
Integrating computer vision and molecular neurobiology to bridge the gap between behavior and the brain.Curr Opin Insect Sci. 2024 Dec;66:101259. doi: 10.1016/j.cois.2024.101259. Epub 2024 Sep 5. Curr Opin Insect Sci. 2024. PMID: 39244088 Free PMC article. Review.
References
Publication types
MeSH terms
Associated data
Grants and funding
LinkOut - more resources
Full Text Sources
