

Trends of blood pressure and heart rate in normal pregnancies: a systematic review and meta-analysis
- PMID: 31506067
- PMCID: PMC6737610
- DOI: 10.1186/s12916-019-1399-1
Trends of blood pressure and heart rate in normal pregnancies: a systematic review and meta-analysis
Abstract
Background: Current reference ranges for blood pressure and heart rate throughout pregnancy have a poor evidence base.
Methods: This is a systematic review and meta-analysis. We included studies measuring blood pressure or heart rate from healthy pregnant women within defined gestational periods of 16 weeks or less. We analysed systolic blood pressure, diastolic blood pressure and heart rate by gestational age. We assessed effects of measurement year and method.
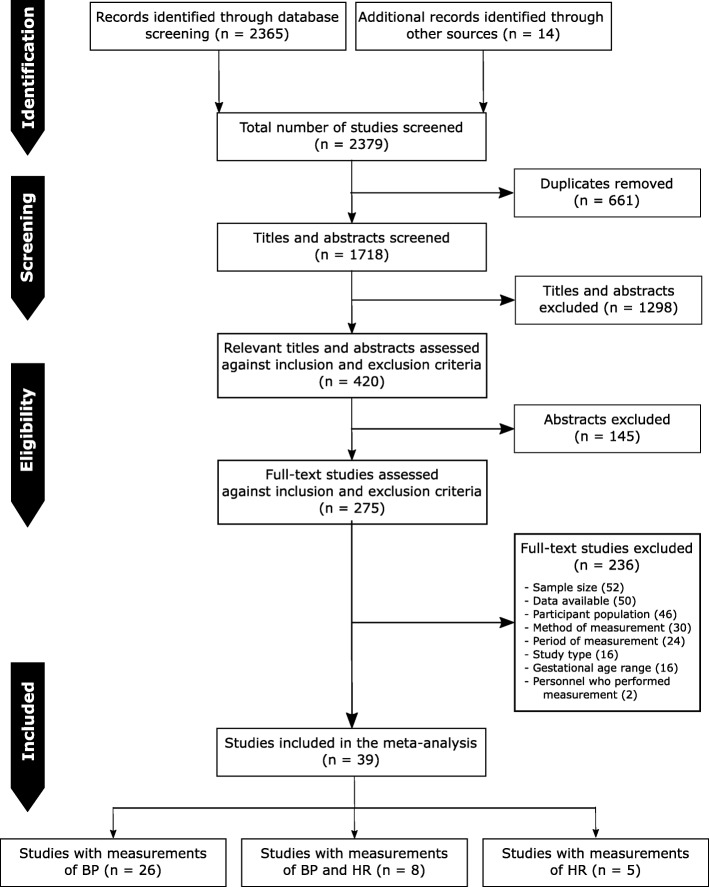
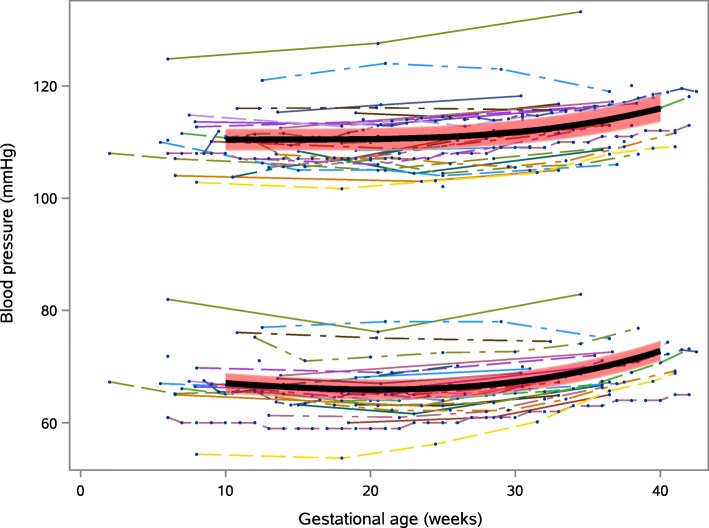
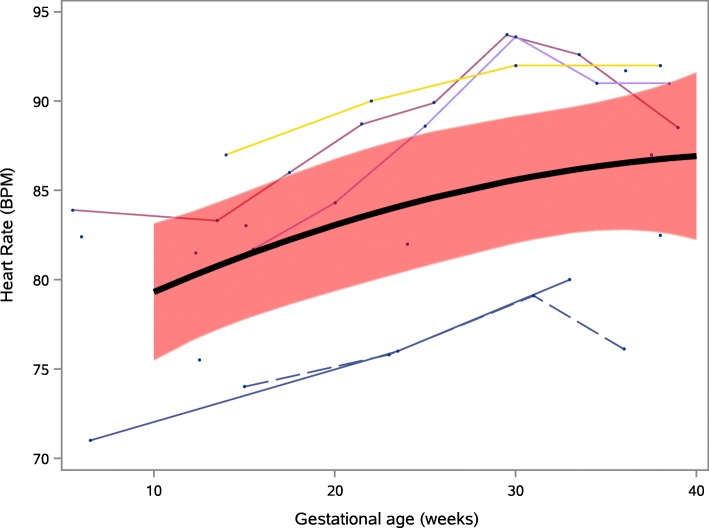
Results: We included 39 studies undertaken in 1967-2017, containing 124,349 systolic measurements from 36,239 women, 124,291 diastolic measurements from 36,181 women and 10,948 heart rate measurements from 8317 women. Mean (95% CI) systolic blood pressure was lowest at 10 weeks gestation, 110.4 (108.5, 112.3) mmHg, rising to 116.0 (113.6, 118.4) mmHg at 40 weeks, mean (95% CI) change 5.6 (4.0, 7.2) mmHg. Mean (95% CI) diastolic blood pressure was lowest at 21 weeks gestation, 65.9 (64.2, 67.7) mmHg; rising to 72.8 (71.0, 74.6) mmHg at 40 weeks, mean (95% CI) change 6.9 (6.2, 7.5) mmHg. Mean (95% CI) heart rate rose from 79.3 (75.5, 83.1) beats/min at 10 weeks to 86.9 (82.2, 91.6) beats/min at 40 weeks gestation, mean (95% CI) change 7.6 (1.8, 13.4) beats/min. Studies using manual measurement reported higher diastolic blood pressures than studies using automated measurement, mean (95 CI) difference 4.9 (0.8, 8.9) mmHg. Diastolic blood pressure increased by 0.26 (95% CI 0.10-0.43) mmHg/year. Including only higher-quality studies had little effect on findings, with heterogeneity remaining high (I2 statistic > 50%).
Conclusions: Significant gestational blood pressure and heart rate changes occur that should be taken into account when assessing pregnant women. Commonly taught substantial decreases in blood pressure mid-pregnancy were not seen and heart rate increases were lower than previously thought. Manual and automated blood pressure measurement cannot be used interchangeably. Increases in diastolic blood pressure over the last half-century and differences between published studies show contemporary data are required to define current normal ranges.
Study registration: PROSPERO CRD42014009673.
Keywords: Blood pressure (MeSH); Heart rate (MeSH); Maternal physiology; Pregnancy (MeSH); Vital signs (MeSH).
Conflict of interest statement
PW, JB, SM and SF report significant grants from the National Institute of Health Research (NIHR), UK. PW, JB, SM, LM and SF report significant grants from the NIHR Biomedical Research Centre, Oxford, during the conduct of the study. PW and LM report modest grants and personal fees from Sensyne Health, outside the submitted work. LL and RP report significant grants from the RCUK Digital Economy Programme. LL reports significant grants from the Clarendon Fund. LL now works for the Boston Consulting Group, whose clients include medical technology and health analytics companies. PW and LM work part-time for Sensyne Health. PW and LM hold shares in Sensyne Health.
Figures
Similar articles
-
International gestational age-specific centiles for blood pressure in pregnancy from the INTERGROWTH-21st Project in 8 countries: A longitudinal cohort study.PLoS Med. 2021 Apr 27;18(4):e1003611. doi: 10.1371/journal.pmed.1003611. eCollection 2021 Apr. PLoS Med. 2021. PMID: 33905424 Free PMC article.
-
Folic acid supplementation and malaria susceptibility and severity among people taking antifolate antimalarial drugs in endemic areas.Cochrane Database Syst Rev. 2022 Feb 1;2(2022):CD014217. doi: 10.1002/14651858.CD014217. Cochrane Database Syst Rev. 2022. PMID: 36321557 Free PMC article.
-
[Circadian blood pressure variation in normal pregnancy, gestational hypertension, and preeclampsia].Med Clin (Barc). 2003 Apr 19;120(14):521-8. doi: 10.1016/s0025-7753(03)73764-6. Med Clin (Barc). 2003. PMID: 12724063 Spanish.
-
[Behavior of blood pressure and heart rate at rest and during standing in pregnancy].Z Geburtshilfe Perinatol. 1993 Nov-Dec;197(6):250-6. Z Geburtshilfe Perinatol. 1993. PMID: 8147043 Clinical Trial. German.
-
Blood pressure adjustments throughout healthy and hypertensive pregnancy: A systematic review and meta-analysis.Pregnancy Hypertens. 2022 Mar;27:51-58. doi: 10.1016/j.preghy.2021.12.004. Epub 2021 Dec 11. Pregnancy Hypertens. 2022. PMID: 34929556
Cited by
-
Effects of aerobic, strength, and combined training during pregnancy in the blood pressure: A systematic review and meta-analysis.Front Physiol. 2022 Aug 30;13:916724. doi: 10.3389/fphys.2022.916724. eCollection 2022. Front Physiol. 2022. PMID: 36111150 Free PMC article.
-
Pregnancy Arrhythmias: Management in the Emergency Department and Critical Care.J Clin Med. 2024 Feb 15;13(4):1095. doi: 10.3390/jcm13041095. J Clin Med. 2024. PMID: 38398407 Free PMC article. Review.
-
The impact of healthy pregnancy on features of heart rate variability and pulse wave morphology derived from wrist-worn photoplethysmography.Sci Rep. 2023 Nov 30;13(1):21100. doi: 10.1038/s41598-023-47980-2. Sci Rep. 2023. PMID: 38036597 Free PMC article.
-
Trends in Heart Rate and Heart Rate Variability During Pregnancy and the 3-Month Postpartum Period: Continuous Monitoring in a Free-living Context.JMIR Mhealth Uhealth. 2022 Jun 3;10(6):e33458. doi: 10.2196/33458. JMIR Mhealth Uhealth. 2022. PMID: 35657667 Free PMC article.
-
Blood Pressure Variability in Pregnancy: an Opportunity to Develop Improved Prognostic and Risk Assessment Tools.Curr Hypertens Rep. 2020 Feb 1;22(1):10. doi: 10.1007/s11906-019-1014-z. Curr Hypertens Rep. 2020. PMID: 32008117 Free PMC article. Review.
References
-
- Swanton RDJ, Al-Rawi S, Wee MYK. A national survey of obstetric early warning systems in the United Kingdom. Int J Obstet Anesth. 2009;18:253–257. - PubMed
-
- Smith GB, Isaacs R, Andrews L, Wee MY, van Teijlingen E, Bick DE, et al. Vital signs and other observations used to detect deterioration in pregnant women: an analysis of vital sign charts in consultant-led UK maternity units. Int J Obstet Anesth. 2017;30:44–51. - PubMed
-
- Paterson-Brown S, Howell C. Managing Obstetric Emergencies and Trauma (MOET): Course manual. Cambridge: Cambridge University Press; 2014.
-
- Isaacs RA, Wee MYK, Bick DE, Beake S, Sheppard ZA, Thomas S, et al. A national survey of obstetric early warning systems in the United Kingdom: five years on. Anaesthesia. 2014;69(7):687–692. - PubMed
-
- Winter C, Crofts J, Laxton C, Barnfield S, Draycott T, editors. PRactical Obstetric Multi-Professional Training (PROMPT): course manual. Cambridge: Cambridge University Press; 2012.
Publication types
MeSH terms
Grants and funding
LinkOut - more resources
Full Text Sources
Medical
