. 2019 Nov 1;294(44):16080-16094.
doi: 10.1074/jbc.RA119.008515. Epub 2019 Sep 10.

Regulation of Skn7-dependent, oxidative stress-induced genes by the RNA polymerase II-CTD phosphatase, Fcp1, and Mediator kinase subunit, Cdk8, in yeast

Affiliations

Regulation of Skn7-dependent, oxidative stress-induced genes by the RNA polymerase II-CTD phosphatase, Fcp1, and Mediator kinase subunit, Cdk8, in yeast

Maria J Aristizabal et al. J Biol Chem. .

Abstract

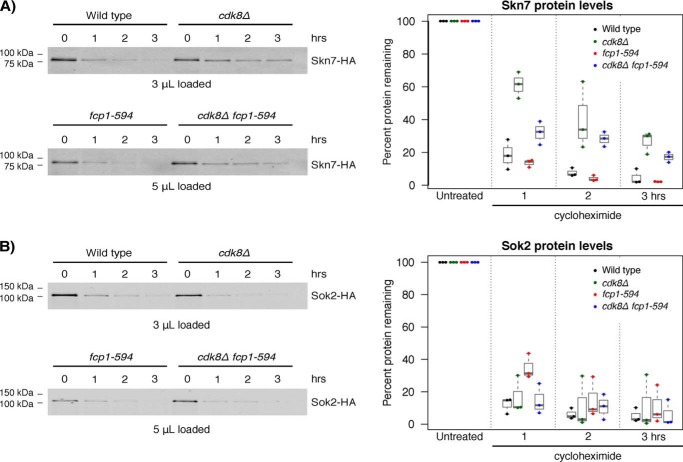
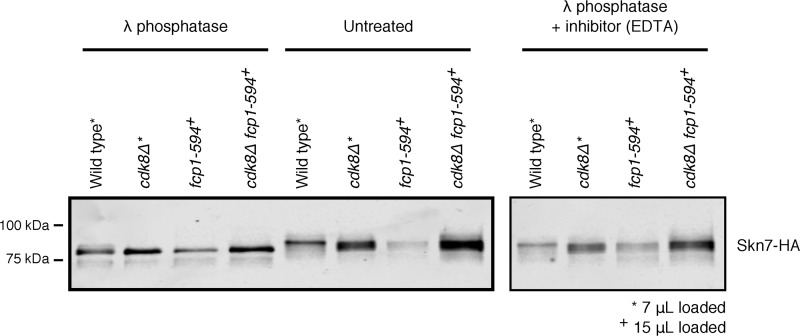
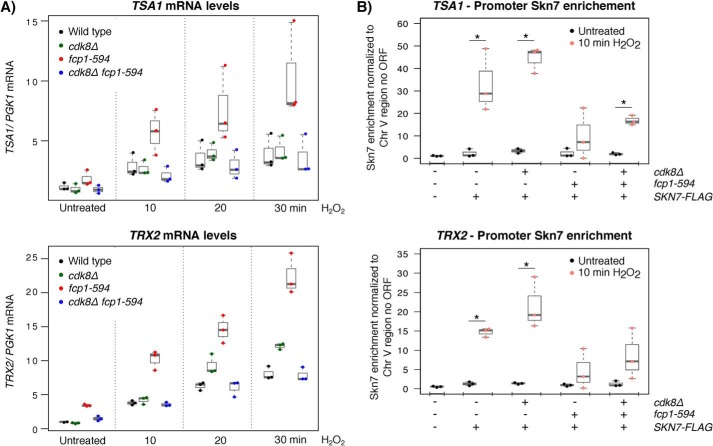
Fcp1 is a protein phosphatase that facilitates transcription elongation and termination by dephosphorylating the C-terminal domain of RNA polymerase II. High-throughput genetic screening and gene expression profiling of fcp1 mutants revealed a novel connection to Cdk8, the Mediator complex kinase subunit, and Skn7, a key transcription factor in the oxidative stress response pathway. Briefly, Skn7 was enriched as a regulator of genes whose mRNA levels were altered in fcp1 and cdk8Δ mutants and was required for the suppression of fcp1 mutant growth defects by loss of CDK8 under oxidative stress conditions. Targeted analysis revealed that mutating FCP1 decreased Skn7 mRNA and protein levels as well as its association with target gene promoters but paradoxically increased the mRNA levels of Skn7-dependent oxidative stress-induced genes (TRX2 and TSA1) under basal and induced conditions. The latter was in part recapitulated via chemical inhibition of transcription in WT cells, suggesting that a combination of transcriptional and posttranscriptional effects underscored the increased mRNA levels of TRX2 and TSA1 observed in the fcp1 mutant. Interestingly, loss of CDK8 robustly normalized the mRNA levels of Skn7-dependent genes in the fcp1 mutant background and also increased Skn7 protein levels by preventing its turnover. As such, our work suggested that loss of CDK8 could overcome transcriptional and/or posttranscriptional alterations in the fcp1 mutant through its regulatory effect on Skn7. Furthermore, our work also implicated FCP1 and CDK8 in the broader response to environmental stressors in yeast.

Keywords: Cdk8; Fcp1; Mediator complex; RNA polymerase II; Skn7; gene regulation; oxidative stress; transcription; transcription factor; transcription regulation; transcription repression; transcriptomics; yeast transcription.


Conflict of interest statement

The authors declare that they have no conflicts of interest with the contents of this article

Figures

Figure 1.
Figure 1.
FCP1 mutants were sensitive to genotoxic agents and environmental stressors. A, schematic of FCP1 illustrating the FCPH catalytic domain, BRCT domain, and TFIIF/TFIIB-interacting region. The FCP1 mutants differentially removed the TFIIF/TFIIB-binding regions. B, the two shortest FCP1 mutants were sensitive to high (37 °C) and low (16 °C) temperatures and the indicated concentrations of hydroxyurea, methyl methanesulfonate, sodium chloride (NaCl; osmotic stress), and hydrogen peroxide (H2O2; oxidative stress). Cells with the indicated mutations were serially diluted 10-fold, spotted on YPD media with the indicated drug concentrations, and grown for 2–4 days.
Figure 2.
Figure 2.
The fcp1-594 and fcp1-609 mutants resulted in an overlapping set of gene expression alterations. A, heat map of mRNA levels showing genes differentially expressed (p < 0.01 and -fold change > 1.7) in the fcp1-594 or fcp1-609 mutant. Yellow, increased mRNA levels compared with WT; blue, decreased levels. B, left, distribution of gene expression -fold changes for the FCP1 mutants showed a length-dependent effect on gene expression. Right, focusing on the shortest mutants revealed that the fcp1-609 and not the shortest fcp1-594 mutant had the greatest number of gene expression defects. C, Venn diagram of genes differentially expressed in the fcp1-609 and fcp1-594 mutant showed a significant overlap (hypergeometric test, p < 0.01) as well as a high degree of gene-specific effects.
Figure 3.
Figure 3.
FCP1 played a role in regulating the mRNA and protein levels of a subset of TFs. A, TFs enriched for regulating genes differentially expressed in the fcp1-594 and fcp1-609 mutant. Light gray bars, enrichment of TFs for genes whose mRNA levels decreased in the fcp1-594 and fcp1-609 mutant; dark gray boxes, enrichment for genes whose mRNA levels increased in the fcp1-594 and fcp1-609 mutant. Most enriched transcription factors significantly associated (p < 0.01) with genes whose mRNA levels decreased in the fcp1-594 and fcp1-609 mutant, with the exception of Ste12, which also showed a significant association with genes whose mRNA levels increased. A significant number of TFs also regulated genes whose mRNA levels are altered upon loss of CDK8 (hypergeometric test, p < 0.01 (*)) and had strong evidence of being phosphorylated proteins (hypergeometric test, p = 0.03769 (#)). B–E, top, the fcp1-594 mutant reduced SKN7, SOK2, and MCM1 mRNA levels but had no effect on CAD1. mRNA levels were normalized to TUB1 (75). mRNA levels are shown as box plots displaying the median and interquartile range, with whiskers denoting 1.5 times the interquartile range. Bottom, immunoblots of Skn7, Sok2, Mcm1, and Cad1 protein levels showed decreased levels in the fcp1-594 mutant compared with WT. Actin was used as a loading control.
Figure 4.
Figure 4.
Genetic interaction profiles of FCP1 mutants were consistent with its function as an RNAPII-CTD phosphatase and supported a role in transcription factor biology. A, the genetic and gene expression profiles revealed similar relationships across the various FCP1 mutants. The scatter plot of profile-paired correlations of the genetic interaction and gene expression profiles revealed a high correlation (0.72). B, distribution of S scores for the FCP1 mutants showed that the fcp1-609 mutant had the greatest number of significant genetic interactions. The S score is a modified T-statistic that captures the significance and strength of the genetic interaction. S scores greater than 2 and less than −2.5 were considered significant. C, Venn diagrams comparing the significant genetic interactions of the fcp1-609 and fcp1-594 mutants. Whereas the overlap in genetic interactions was significant (hypergeometric test, p < 0.01), there were also several genetic interactions that were unique to each mutant. D, subset of genetic interactions for the FCP1 mutants showed significant interactions with SOK2 and SKN7. Each mutant was screened in triplicate, with yellow, blue, and gray indicating alleviating, aggravating, and missing values, respectively.
Figure 5.
Figure 5.
Loss of CDK8 suppressed fcp1-594 and skn7Δ mutant growth defects. Shown is the sensitivity of cdk8Δ, fcp1-594, and either skn7Δ (A) or sok2Δ (B) single, double, and triple mutants to growth under high (37 °C) and low (16 °C) temperatures, and upon exposure to the indicated concentrations of H2O2, NaCl, hydroxyurea, formamide, and methyl methanesulfonate. Loss of CDK8 suppressed the growth defects of both the fcp1-594 and skn7Δ single mutants, suggesting a shared function. Shown are RT-qPCR measurements (left) of SKN7 (C) and SOK2 (D) mRNA levels in WT or the indicated mutants normalized to TUB1 (75). mRNA levels are shown as box plots displaying the median and interquartile range, with whiskers denoting 1.5 times the interquartile range. Immunoblotting (right) of Skn7 (C) and Sok2 (D) bulk protein levels revealed that loss of CDK8 increased Skn7 protein levels in the fcp1-594 mutant background. Extracts were prepared from the indicated strains, and actin was used as a loading control.
Figure 6.
Figure 6.
CDK8 and FCP1 altered Skn7 protein stability. Left, representative immunoblots of Skn7 (A) or Sok2 (B) protein levels before and after inhibition of protein synthesis by the addition of 100 μg/ml cycloheximide. As indicated, protein loading was adjusted in the fcp1-594 and fcp1-594 cdk8Δ mutant with the goal of having similar starting protein amounts. Right, quantification of Skn7 (A) or Sok2 (B) immunoblots with protein levels expressed as a percentage of the untreated control. Loss of CDK8 stabilized Skn7 protein levels in vivo. Normalized protein levels are shown as box plots displaying the median and interquartile range, with whiskers denoting 1.5 times the interquartile range.
Figure 7.
Figure 7.
Phosphorylation of Skn7 depended on CDK8 and FCP1. Skn7 purified by immunoprecipitation was untreated or treated with 200 units of λ-phosphatase for 1 h in the presence or absence of 100 mm EDTA inhibitor, as indicated. Slower Skn7 migration was observed in untreated samples and in samples treated with λ-phosphatase plus EDTA phosphatase inhibitor, indicating the presence of phosphorylation. Reduced but not completely abolished phosphorylation was observed in the fcp1-594, cdk8Δ, and fcp1-594 cdk8Δ mutants compared with WT. Protein loading was adjusted as indicated.
Figure 8.
Figure 8.
FCP1 altered expression of TSA1 and TRX2 in a CDK8-dependent manner. A, RT-qPCR analysis of TSA1 (top) and TRX2 (bottom) mRNA levels with and without H2O2 treatment normalized to PGK1 mRNA levels. The elevated TRX2 and TSA1 mRNA levels detected in the fcp1-594 mutant were normalized by loss of CDK8. B, ChIP-qPCR analysis of Skn7 at the promoter of TSA1 (top) and TRX2 (bottom). Skn7 levels were normalized to an intergenic region of chromosome V (72). The fcp1-594 mutant reduced Skn7 enrichment at the promoter of TRX2 and TSA1 upon induction. *, p < 0.05 using a two-tailed Student's t test. RT-qPCR and ChIP-qPCR results are shown as box plots displaying the median and interquartile range, with whiskers denoting 1.5 times the interquartile range.

Similar articles

Cited by

References

    1. Allison L. A., and Ingles C. J. (1989) Mutations in RNA polymerase II enhance or suppress mutations in GAL4. Proc. Natl. Acad. Sci. U.S.A. 86, 2794–2798 10.1073/pnas.86.8.2794 - DOI - PMC - PubMed
    1. Nonet M., Sweetser D., and Young R. A. (1987) Functional redundancy and structural polymorphism in the large subunit of RNA polymerase II. Cell 50, 909–915 10.1016/0092-8674(87)90517-4 - DOI - PubMed
    1. Corden J. L., Cadena D. L., Ahearn J. M. Jr., and Dahmus M. E. (1985) A unique structure at the carboxyl terminus of the largest subunit of eukaryotic RNA polymerase II. Proc. Natl. Acad. Sci. U.S.A. 82, 7934–7938 10.1073/pnas.82.23.7934 - DOI - PMC - PubMed
    1. Harlen K. M., and Churchman L. S. (2017) The code and beyond: transcription regulation by the RNA polymerase II carboxy-terminal domain. Nat. Rev. Mol. Cell Biol. 18, 263–273 10.1038/nrm.2017.10 - DOI - PubMed
    1. Zaborowska J., Egloff S., and Murphy S. (2016) The pol II CTD: new twists in the tail. Nat. Struct. Mol. Biol. 23, 771–777 10.1038/nsmb.3285 - DOI - PubMed

Publication types

MeSH terms