. 2019 Nov 1;294(44):16049-16061.
doi: 10.1074/jbc.RA119.007416. Epub 2019 Sep 10.

Molecular identification of HSPA8 as an accessory protein of a hyperpolarization-activated chloride channel from rat pulmonary vein cardiomyocytes

Affiliations

Molecular identification of HSPA8 as an accessory protein of a hyperpolarization-activated chloride channel from rat pulmonary vein cardiomyocytes

Yosuke Okamoto et al. J Biol Chem. .

Abstract

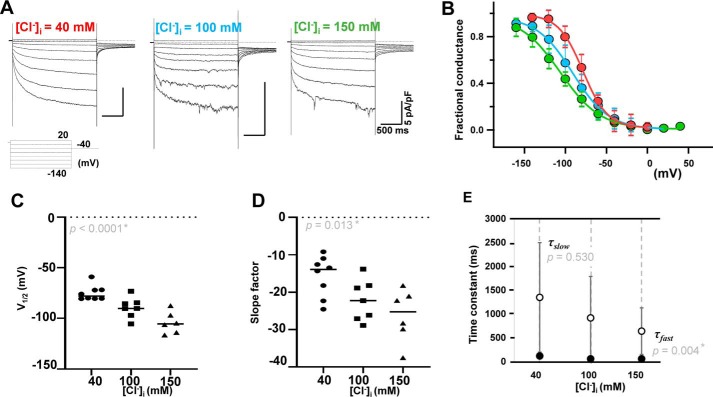
Pulmonary veins (PVs) are the major origin of atrial fibrillation. Recently, we recorded hyperpolarization-activated Cl- current (ICl, h) in rat PV cardiomyocytes. Unlike the well-known chloride channel protein 2 (CLCN2) current, the activation curve of ICl, h was hyperpolarized as the Cl- ion concentration ([Cl-] i ) increased. This current could account for spontaneous activity in PV cardiomyocytes linked to atrial fibrillation. In this study, we aimed to identify the channel underlying ICl, h Using RT-PCR amplification specific for Clcn2 or its homologs, a chloride channel was cloned from rat PV and detected in rat PV cardiomyocytes using immunocytochemistry. The gene sequence and electrophysiological functions of the protein were identical to those previously reported for Clcn2, with protein activity observed as a hyperpolarization-activated current by the patch-clamp method. However, the [Cl-] i dependence of activation was entirely different from the observed ICl, h of PV cardiomyocytes; the activation curve of the Clcn2-transfected cells shifted toward positive potential with increased [Cl-] i , whereas the ICl, h of PV and left ventricular cardiomyocytes showed a leftward shift. Therefore, we used MS to explore the possibility of additional proteins interacting with CLCN2 and identified an individual 71-kDa protein, HSPA8, that was strongly expressed in rat PV cardiomyocytes. With co-expression of HSPA8 in HEK293 and PC12 cells, the CLCN2 current showed voltage-dependent activation and shifted to negative potential with increasing [Cl-] i Molecular docking simulations further support an interaction between CLCN2 and HSPA8. These findings suggest that CLCN2 in rat heart contains HSPA8 as a unique accessory protein.

Keywords: cardiomyocyte; cardiovascular disease; chloride channel; heart; heat-shock protein (HSP); mass spectrometry (MS).


Conflict of interest statement

The authors declare that they have no conflicts of interest with the contents of this article

Figures

Figure 1.
Figure 1.
Functional cloning of Clcn2 from rat PV. A, detection of full-length 2811-bp rat Clcn2 in the small intestine (SI), used as a positive control, and in PV. The DNA sizes are indicated on the left. The red arrow indicates the exact size of CLCN2. Each pair of adjacent lanes is derived from the same rat (i.e. the PV of four individual rats is shown on the gel). The two most intense bands in the middle of the gel were extracted for gene cloning. B, hyperpolarization-activated Cl currents of cloned Clcn2 were recorded under chloride ion concentrations ([Cl]i) of 40, 100, and 150 mm, with [Cl]o = 148.9 mm. The pulse protocol is indicated at the bottom of the figure. Dashed lines indicate current levels of 0. C, steady-state activation curves under different [Cl]i evaluated by current amplitudes of tail currents at 40 mV. Magenta, marine blue, and green indicate data obtained under [Cl]i of 40, 100, and 150 mm, respectively. n = 7 for each [Cl]i. V1/2 and S values determined by Boltzmann fitting are plotted against [Cl]i in D and E, respectively. Statistically significant difference was calculated from Kruskal-Wallis test. F, slow (τslow) and fast (τfast) time constants at −120 mV obtained by fitting the raw data with a biexponential function are plotted against [Cl]i.
Figure 2.
Figure 2.
Immunocytochemical analysis of cardiomyocytes isolated from PV (left, middle) and LV (right). PV myocyte is labeled with a pair of CLCN2 (green) and Na/K pump (red) and a pair of RyRs (green) and CLCN2s (red). Immunostaining of Na/K pump performed as a plasma membrane marker, and co-localization between CLCN2 and Na/K pump is indicated by yellow color in the overlay image. RyR indicates striated myocardial pattern. LV myocytes are stained with antibodies against RyR and CLCN2.
Figure 3.
Figure 3.
Effect of the chloride ion concentration ([Cl]i) on the voltage dependence of the hyperpolarization-activated Cl current (ICl, h) in left ventricle cardiomyocytes. A, raw traces recorded at [Cl]i of 40, 100, and 150 mm [Cl]i, with [Cl]o = 148.9 mm. Horizontal bars (500 ms) and vertical bars (5 pA/picofarad) are shown for all traces. The pulse protocol is shown. B, steady-state activation curves evaluated by tail currents under different [Cl]i at 40 mV. The color-coding is the same as in Fig. 1. V1/2 and S values are plotted against [Cl]i in C and D, respectively. E, slow (τslow, open circles) and fast (τfast, closed circles) time constants at −120 mV obtained by fitting the raw data with a biexponential function are plotted against [Cl]i.
Figure 4.
Figure 4.
Identification of HSPA8 as a CLCN2-interacting protein. A, detection of CLCN2-interacting proteins in the membrane fraction by Coomassie Brilliant Blue staining. The membrane protein fractions from lysed PV and LV cardiomyocytes were immunologically purified by co-immunoprecipitation (IP) using an anti-CLCN2 antibody and separated by SDS-PAGE. Protein size is indicated on the left. CLCN2 and immunoglobulin heavy and light chain proteins were detected at ∼90, 50, and 25 kDa, respectively. The protein at ∼70 kDa (indicated with arrows) is an unidentified molecule. Precipitant with 10 μg of mouse IgG was loaded in as a negative control. B, determination of the amino acid sequence of the unknown molecule by LC-tandem MS analysis. Mass spectrometry analysis identified eight peptides of rat origin, all of which corresponded to a single protein, HSPA8. The complete 646-amino acid sequence of HSPA8 is displayed. The 90 amino acids used in the identification of the eight peptides are indicated in bold, underlined, italic characters. Coverage was calculated as the ratio of the identified 90 amino acids to the 646 total amino acids. C, confirmation of the protein–protein interaction. Precipitants obtained from the crude membrane fractions of PV or LV using either CLCN2 (left panel) or HSPA8 (right panel) antibody are blotted with the other antibody. Origins of loaded proteins (i.e. PV or LV) are indicated above the corresponding gel lanes. Precipitant with 10 μg of rabbit IgG was also loaded as a negative control on the right panel. IB, immunoblot.
Figure 5.
Figure 5.
Expression and localization of Hspa8 in cardiomyocytes. A, RT-PCR detects full-length 2027-bp Hspa8 (SI; small intestine). The cDNA is subcloned. B, immunocytochemistry of PV cardiomyocytes against HSPA8 (green) and Na/K pump (red). Immunostaining of Na/K pump indicates the location of the cell surface. The overlay image (bottom) emphasizes co-localization of HSPA8 with the plasma membrane marker. Scale bar is 10 μm. C, immunocytochemistry of LV cardiomyocytes against HSPA8 (green) and Na/K pump (red). HSPA8 is located on the cell surfaces. Of note, immunostaining of Na/K pump detects enriched transverse tubule. Scale bar is 10 μm. D, immunoprecipitants in PC12 cells reconfirm the interaction between cloned CLCN2 and HSPA8 again. IP, immunoprecipitation; IB, immunoblot.
Figure 6.
Figure 6.
Effect of Hspa8 expression on the chloride ion concentration ([Cl]i)-dependent voltage-gating in HEK293 cells. Hspa8 was co-transfected with Clcn2. A, [Cl]i was 40 mm (left) and 150 mm (right). The pulse protocol is shown in the inset. Activation curves were evaluated based on the amplitude of tail currents at 40 mV. The initial portion of the tail current is shown in expanded scale in B. Experimental results are summarized by Boltzmann fitting in C. V1/2 and S values are plotted against [Cl]i in D and E, respectively. Of note, the activation curve at [Cl]i is divided into two components, and the low voltage–activated component is statistically significantly different from the activation curve at 40 mm [Cl]i.
Figure 7.
Figure 7.
Effect of Hspa8 overexpression on the [Cl]i-dependent voltage-gating in PC12 cells. A, chloride ion concentration ([Cl]i)-dependent voltage-gating CLCN2 current in PC12 cells without co-transfection of Hspa8. Current traces were obtained using the pulse protocol shown in the inset. The [Cl]i was 40 mm (left) and 150 mm (right). Activation curves were evaluated based on the amplitude of tail currents at 40 mV. The tail current is shown in expanded scale in B. The color-coding of the results is the same as in Fig. 1. C, activation curves are gained by Boltzmann fittings. D, CLCN2 current in PC12 cells with co-transfection of Hspa8. The pulse protocol is same as A. The tail current and activation curve are shown in E. The activation curves are fitted with a double-Boltzmann function in F, and contributions of the low voltage–activated component are overviewed in G. H, time constants of the Cl currents activated −160 to −80 mV. The currents were evoked in PC12 cells with or without overexpression of Hspa8 in both conditions of [Cl]i = 40 and 150 mm. The two-way ANOVA undetected impact of Hspa8 on the value is shown. I, τfast (closed circles) and τslow (open circles) of tail currents at 40 mV following activation by hyperpolarization of −160 mV are measured in PC12 cells with or without overexpression of Hspa8 in both conditions of [Cl]i = 40 and 150 mm.
Figure 8.
Figure 8.
Other electrophysiological parameters for HEK293 and PC12 cells. The amplitudes of the CLCN2 currents were evaluated by tail currents at 40 mV following the hyperpolarization to −120 mV. The data obtained using HEK293 cells are summarized in A, and PC12 data are summarized in B. The data are classified by experimental conditions, i.e. [Cl]i, cell type, and co-expression of Hspa8, as indicated. C and D summarize cell capacitance (Cm) of cells. According to the Mann-Whitney test for each experimental condition (cell type and [Cl]i), Hspa8 expression affects current amplitude at 40 mm [Cl]i in HEK293 cells; otherwise, no statistical significance was detected.
Figure 9.
Figure 9.
High-throughput simulation of protein–protein docking between rat CLCN2 and human HSP90. Protein structures of CLCN2 (cyan and green) and HSP90 (olive and wheat) were homologically modeled by SWISS-MODEL. Docking states were calculated using ClusPro 2.0. The highest priority model is visualized as a cartoon ribbon structure (A) and with protein surface (B). The upper panels in A and B are side views of the model with a tentative plasma membrane (gray lines). The corresponding lower panels are bottom views, which illustrate the intracellular side of the subunit assembly. Anion-selective protopore gates are indicated in red. C, surface electrostatic potential is color-coded by the kT/e unit. One of the HSP90 proteins (olive color in the top panel) is subtracted in the middle, displaying an electrostatically strong docking site (dotted line). The cartoon structure (bottom) indicates that the docking site does not affect the homodimeric interface.
Figure 10.
Figure 10.
Protein–protein docking between rat CLCN2 and HSPA8. Protein structures of CLCN2 (cyan and green) and HSPA8 (olive and wheat) were homologically modeled, and docking states were calculated using ClusPro 2.0. The highest priority model is visualized with a tentative plasma membrane (gray lines). The upper and lower panels in A and B display side and bottom views, respectively. The anion-selective protopore gates are colored red. C, surface electrostatic potential is color-coded by the kT/e unit. One of the HSPA8 proteins (olive color in the top panel) is subtracted in the middle, displaying an electrostatically strong docking site (dotted line). The cartoon structure (bottom) indicates that the docking site interacts with the homodimeric interface.

Similar articles

Cited by

References

    1. Haïssaguerre M., Jaïs P., Shah D. C., Takahashi A., Hocini M., Quiniou G., Garrigue S., Le Mouroux A., Le Métayer P., and Clémenty J. (1998) Spontaneous initiation of atrial fibrillation by ectopic beats originating in the pulmonary veins. N. Engl. J. Med. 339, 659–666 10.1056/NEJM199809033391003 - DOI - PubMed
    1. Chugh S. S., Havmoeller R., Narayanan K., Singh D., Rienstra M., Benjamin E. J., Gillum R. F., Kim Y. H., McAnulty J. H. Jr., Zheng Z. J., Forouzanfar M. H., Naghavi M., Mensah G. A., Ezzati M., and Murray C. J. (2014) Worldwide epidemiology of atrial fibrillation: a global burden of disease 2010 study. Circulation 129, 837–847 10.1161/CIRCULATIONAHA.113.005119 - DOI - PMC - PubMed
    1. Cheung D. W. (1981) Electrical activity of the pulmonary vein and its interaction with the right atrium in the guinea pig. J. Physiol. 314, 445–456 10.1113/jphysiol.1981.sp013718 - DOI - PMC - PubMed
    1. Doisne N., Maupoil V., Cosnay P., and Findlay I. (2009) Catecholaminergic automatic activity in the rat pulmonary vein: electrophysiological differences between cardiac muscle in the left atrium and pulmonary vein. Am. J. Physiol. Heart Circ. Physiol. 297, H102–H108 10.1152/ajpheart.00256.2009 - DOI - PubMed
    1. Okamoto Y., Takano M., Ohba T., and Ono K. (2012) Arrhythmogenic coupling between the Na+–Ca2+ exchanger and inositol 1,4,5-triphosphate receptor in rat pulmonary vein cardiomyocytes. J. Mol. Cell. Cardiol. 52, 988–997 10.1016/j.yjmcc.2012.01.007 - DOI - PubMed

Publication types

MeSH terms