. 2019 Oct 7;9(10):3105-3118.
doi: 10.1534/g3.118.200930.

Programmed Chromosome Deletion in the Ciliate Oxytricha trifallax

Affiliations

Programmed Chromosome Deletion in the Ciliate Oxytricha trifallax

Derek M Clay et al. G3 (Bethesda). .

Abstract

The ciliate Oxytricha trifallax contains two nuclei: a germline micronucleus and a somatic macronucleus. These two nuclei diverge significantly in genomic structure. The micronucleus contains approximately 100 chromosomes of megabase scale, while the macronucleus contains 16,000 gene-sized, high ploidy "nanochromosomes." During its sexual cycle, a copy of the zygotic germline micronucleus develops into a somatic macronucleus via DNA excision and rearrangement. The rearrangement process is guided by multiple RNA-based pathways that program the epigenetic inheritance of sequences in the parental macronucleus of the subsequent generation. Here, we show that the introduction of synthetic DNA molecules homologous to a complete native nanochromosome during the rearrangement process results in either loss or heavy copy number reduction of the targeted nanochromosome in the macronucleus of the subsequent generation. This phenomenon was tested on a variety of nanochromosomes with different micronuclear structures, with deletions resulting in all cases. Deletion of the targeted nanochromosome results in the loss of expression of the targeted genes, including gene knockout phenotypes that were phenocopied using alternative knockdown approaches. Further investigation of the chromosome deletion showed that, although the full length nanochromosome was lost, remnants of the targeted chromosome remain. We were also able to detect the presence of telomeres on these remnants. The chromosome deletions and remnants are epigenetically inherited when backcrossed to wild type strains, suggesting that an undiscovered mechanism programs DNA elimination and cytoplasmically transfers to both daughter cells during conjugation. Programmed deletion of targeted chromosomes provides a novel approach to investigate genome rearrangement and expands the available strategies for gene knockout in Oxytricha trifallax.

Keywords: Ciliates; Epigenetics; Genomic Rearrangement.


Figures

Figure 1
Figure 1
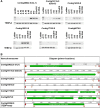
DNA injections result in the deletion of nanochromosomes from the subsequent generation. A) PCR amplification from genomic DNA harvested from screened and established lines shows loss of the targeted nanochromosome. The top gel section of each panel shows the deleted chromosome as labeled above, with the name of deletion lines (marked Δ) established and assayed in this experiment. The bottom gel section of each panel shows PCR amplification of the TEBP-β gene as input loading control. Deletion line shown in comparison to the parental lines (strains JRB310 and JRB510, marked simply 310 or 510) or the uninjected F1 population derived from mating the two parental lines. In the ΔOtiwi1 panels, deletion lines 1 and 2 were generated through injection of a construct containing a 28 bp deletion while line 3 was generated using a full length Otiwi1 chromosome construct. B) Diagram of the nanochromosomes in the PCRs in panel A with the following features labeled: telomeres (red), the locations of genes (green), and the location of the primers used in panel A (pink).
Figure 2
Figure 2
Sequence coverage for a deleted chromosome is decreased in deletion lines. Normalized read depth from Illumina whole genome sequencing mapped to targeted chromosomes shows a strong decrease in the deletion lines relative to the uninjected F1 lines derived from JRB310xJRB510 matings. The first deletion line is labeled in red and second line depicted in blue.
Figure 3
Figure 3
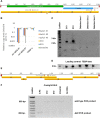
Remnants of deleted chromosomes are detected in some of the deletion lines. A) A diagram of the AL1 nanochromosome with various features labeled, including the locations of the telomeres (red), the AL1 gene (green), the MDSs (gold), the qPCR primers (pink, labeled with which qPCR they belong to in panel B, and hybridization region of the Southern probe (blue). B) Quantification of the 3′ and 5′ end of the chromosome via qPCR and the relative copy vs. the JRB310xJRB510 F1 genomic DNA. Error bars represent the standard deviation. C) Southern analysis of the first 3 contig20822.0 (AL1) deletion lines (#1, #2, and #3) using a probe against the 3′ end of the nanochromosome. D) The same membrane was then stripped and re-probed with TEBP-beta for loading control. E) A depiction of the contig14335.0 nanochromosome with MDSs (gold), telomeres (red), and the gene specific primers for the two rounds of telomeric PCR (pink, labeled with which PCR round they are involved in) labeled. F) Second round of telomeric PCR (see methods for description of telomeric PCR) for the 5′ end of the Contig14335.0 chromosome in contig14335.0 deletion line #2. Telomeric PCR products from contig14335.0 deletion line #2 were Sanger sequenced to identify the exact location of the aberrant telomere addition (see supplementary figure 6).
Figure 4
Figure 4
Deletions and remnants are epigenetically inherited A) An illustration of the contig14335.0 with primer locations depicted (purple for the detection PCR shown in panels C and E, pink for the qPCR primers, labeled with the corresponding qPCR they belong to in panels C, E, G). In addition, the locations of the MDSs (gold) and telomeres (red) on the nanochromosome are shown. B) Diagram of the various crosses involved generating the progeny involved in panels C and D. The colors in the diagram correspond to the colors in panel D. C) PCR amplification of genomic DNA harvested from populations of the progeny of ctg14335.0 deletion line 1 mated to deletion line 2, with parental lines and grandparental lines, along with uninjected 310x510 as controls. Lower gel section shows PCR amplification of TEBP-β as loading control. D) Quantitative PCR on the F1 from ctg14335.0 deletion line 1 mated to deletion line 2 surveyed across various regions of the contig14335.0 nanochromosome. E) Diagram of the various crosses involved generating the progeny involved in panels F and G. The colors from the diagram correspond to the colors in the following panel G. F) PCR amplification from genomic DNA harvested from populations of ctg14335.0 deletion line 1 backcrossed to wt strain JRB510 for up to 2 generations (labeled F1 and F2) with parental lines and grandparental lines along with uninjected 310x510 as controls. Lower gel section shows PCR amplification of TEBP-β as loading control. G) Quantitative PCR on genomic DNA used in panel A across multiple locations of ctg14335.0, together with an unrelated locus, TEBP-α. Arrows represent undetectable levels at the respective loci, with arrow color corresponding to the legend. Relative copy levels were determined by setting the levels of JRB310xJRB510 F1 to 1. H) Diagram of the various crosses involved generating the progeny in panels I and J. The colors from the diagram correspond to the colors in the following panel J. I) PCR amplification of genomic DNA harvested from clonal isolates and populations (labeled respectively) of the progeny of ctg14335.0 deletion line 2 backcrossed to JRB510, with parental and grandparental lines, along with uninjected JRB310xJRB510 as controls. Lower gel section shows PCR amplification of TEBP-β as loading control. J) Quantitative PCR on F1 genomic DNA from ctg14335.0 deletion line 2 across various regions of contig14335.0.
Figure 4
Figure 4
Deletions and remnants are epigenetically inherited A) An illustration of the contig14335.0 with primer locations depicted (purple for the detection PCR shown in panels C and E, pink for the qPCR primers, labeled with the corresponding qPCR they belong to in panels C, E, G). In addition, the locations of the MDSs (gold) and telomeres (red) on the nanochromosome are shown. B) Diagram of the various crosses involved generating the progeny involved in panels C and D. The colors in the diagram correspond to the colors in panel D. C) PCR amplification of genomic DNA harvested from populations of the progeny of ctg14335.0 deletion line 1 mated to deletion line 2, with parental lines and grandparental lines, along with uninjected 310x510 as controls. Lower gel section shows PCR amplification of TEBP-β as loading control. D) Quantitative PCR on the F1 from ctg14335.0 deletion line 1 mated to deletion line 2 surveyed across various regions of the contig14335.0 nanochromosome. E) Diagram of the various crosses involved generating the progeny involved in panels F and G. The colors from the diagram correspond to the colors in the following panel G. F) PCR amplification from genomic DNA harvested from populations of ctg14335.0 deletion line 1 backcrossed to wt strain JRB510 for up to 2 generations (labeled F1 and F2) with parental lines and grandparental lines along with uninjected 310x510 as controls. Lower gel section shows PCR amplification of TEBP-β as loading control. G) Quantitative PCR on genomic DNA used in panel A across multiple locations of ctg14335.0, together with an unrelated locus, TEBP-α. Arrows represent undetectable levels at the respective loci, with arrow color corresponding to the legend. Relative copy levels were determined by setting the levels of JRB310xJRB510 F1 to 1. H) Diagram of the various crosses involved generating the progeny in panels I and J. The colors from the diagram correspond to the colors in the following panel J. I) PCR amplification of genomic DNA harvested from clonal isolates and populations (labeled respectively) of the progeny of ctg14335.0 deletion line 2 backcrossed to JRB510, with parental and grandparental lines, along with uninjected JRB310xJRB510 as controls. Lower gel section shows PCR amplification of TEBP-β as loading control. J) Quantitative PCR on F1 genomic DNA from ctg14335.0 deletion line 2 across various regions of contig14335.0.

Similar articles

Cited by

References

    1. Adikusuma F., Williams N., Grutzner F., Hughes J., and Thomas P., 2017. Targeted Deletion of an Entire Chromosome Using CRISPR/Cas9. Mol. Ther. 25: 1736–1738. 10.1016/j.ymthe.2017.05.021 - DOI - PMC - PubMed
    1. Allen A. E., and Nowacki M., 2017. Necessity Is the Mother of Invention: Ciliates, Transposons, and Transgenerational Inheritance. Trends Genet. 33: 197–207. 10.1016/j.tig.2017.01.005 - DOI - PubMed
    1. Baudry C., Malinsky S., Restituito M., Kapusta A., Rosa S. et al. , 2009. PiggyMac, a domesticated piggyBac transposase involved in programmed genome rearrangements in the ciliate Paramecium tetraurelia. Genes Dev. 23: 2478–2483. 10.1101/gad.547309 - DOI - PMC - PubMed
    1. Bracht J. R., Wang X., Shetty K., Chen X., Uttarotai G. J. et al. , 2017. Chromosome fusions triggered by noncoding RNA. RNA Biol. 14: 620–631. 10.1080/15476286.2016.1195940 - DOI - PMC - PubMed
    1. Chang W. J., Stover N. A., Addis V. M., and Landweber L. F., 2004. A micronuclear locus containing three protein-coding genes remains linked during macronuclear development in the spirotrichous ciliate Holosticha. Protist 155: 245–255. 10.1078/143446104774199628 - DOI - PubMed

Publication types

LinkOut - more resources