. 2019 Sep 10;12(598):eaap7336.
doi: 10.1126/scisignal.aap7336.

Inflammation induces stress erythropoiesis through heme-dependent activation of SPI-C

Affiliations

Inflammation induces stress erythropoiesis through heme-dependent activation of SPI-C

Laura F Bennett et al. Sci Signal. .

Abstract

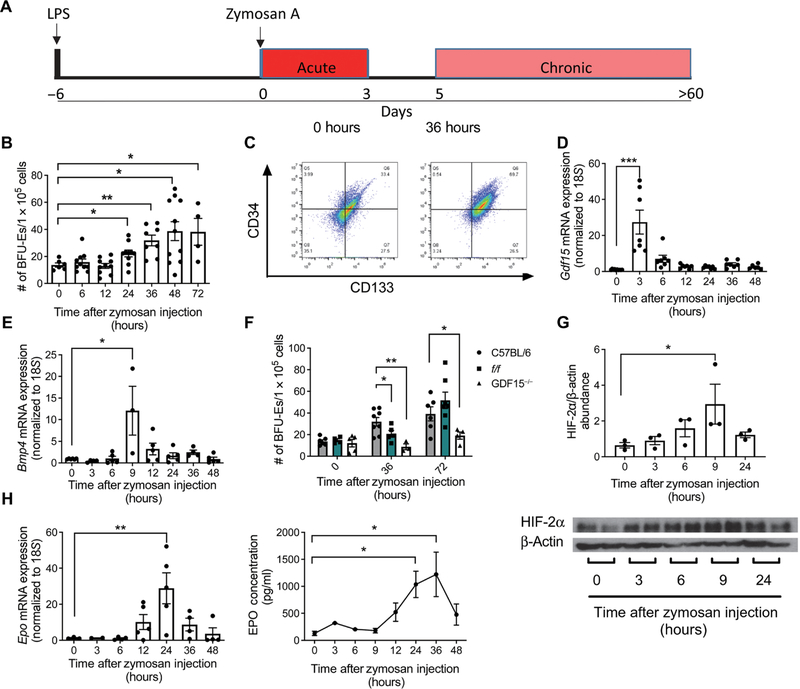
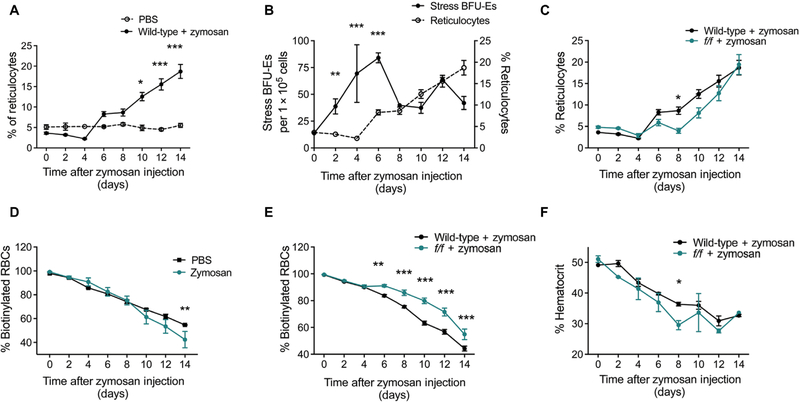
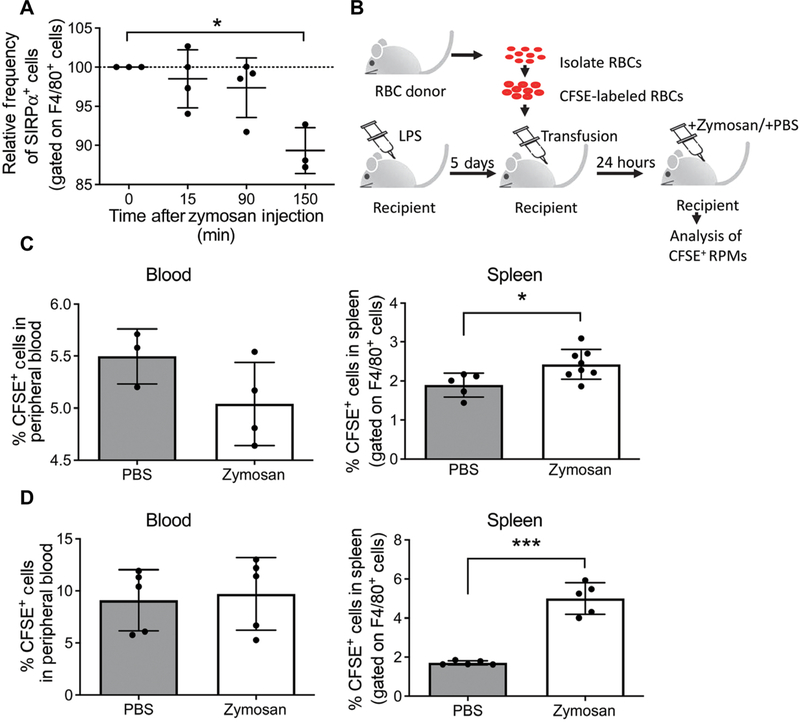
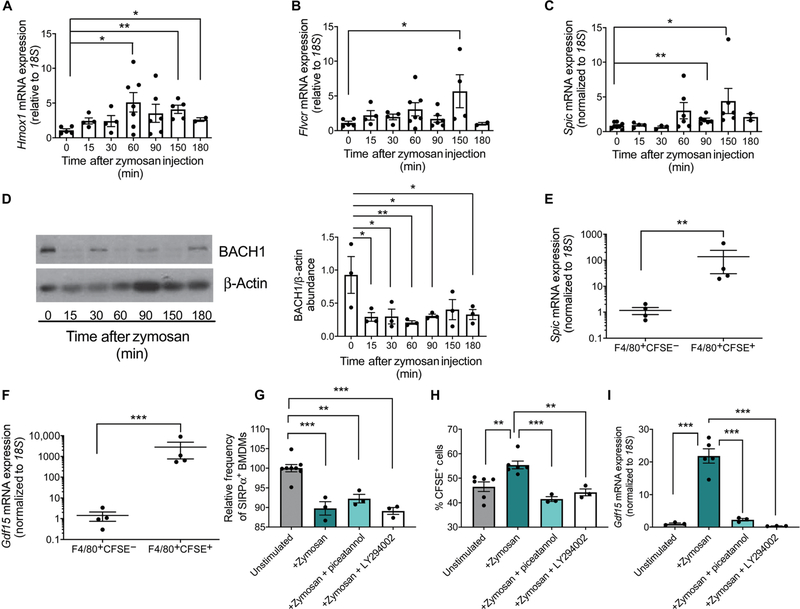
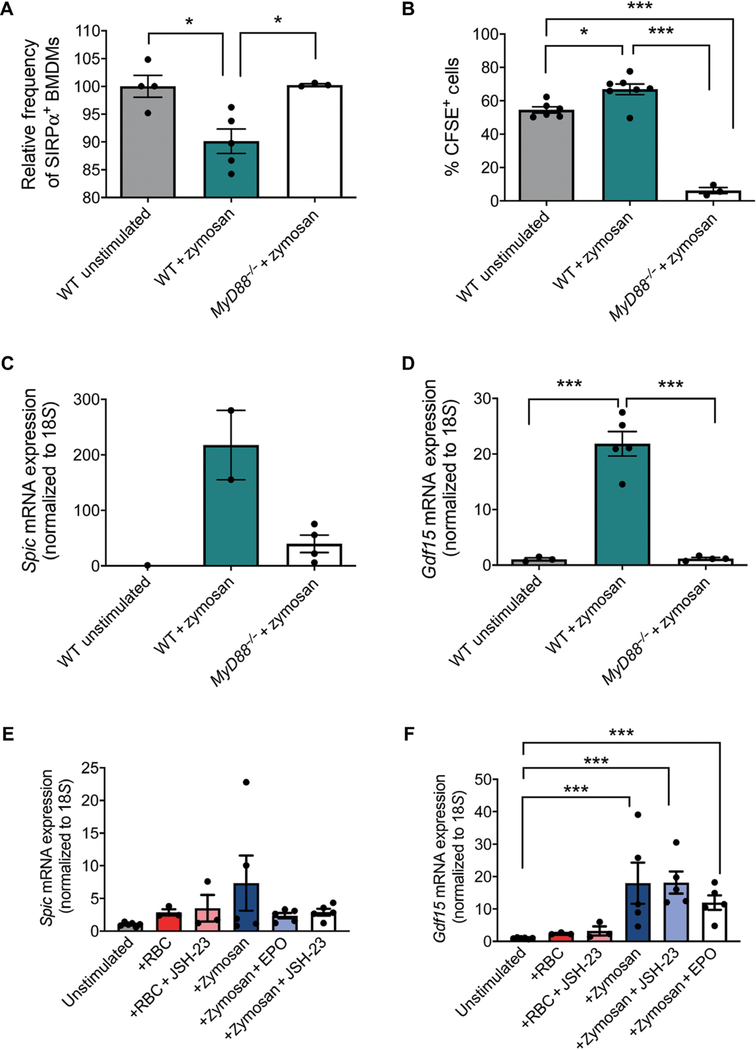
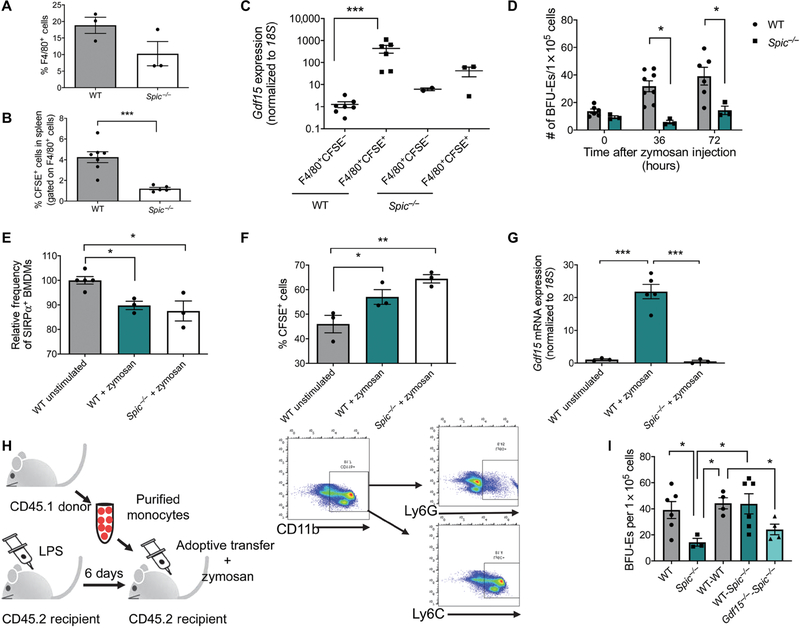
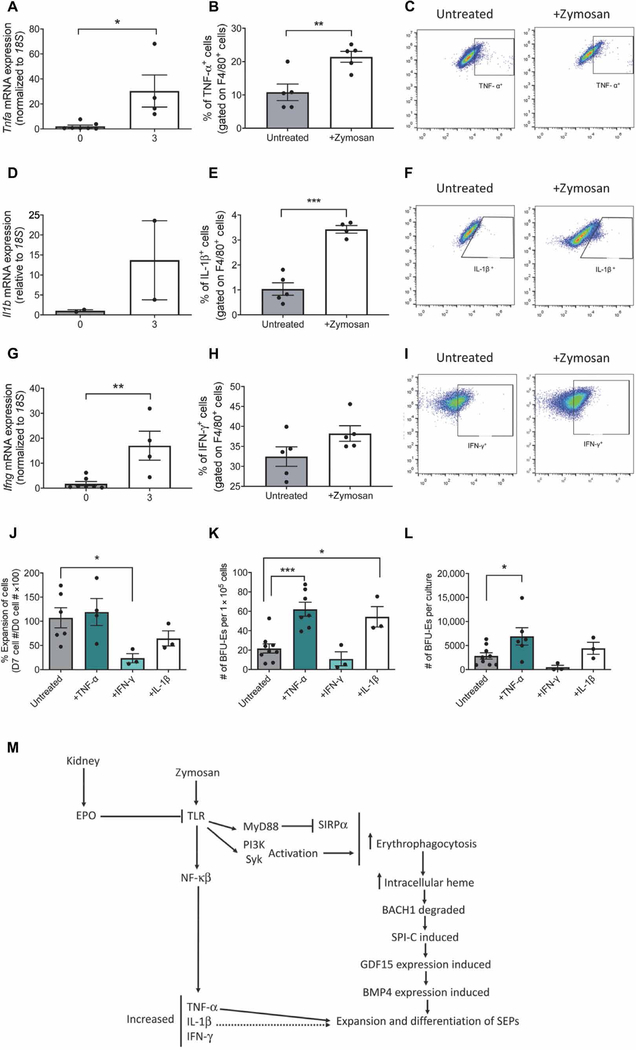
Inflammation alters bone marrow hematopoiesis to favor the production of innate immune effector cells at the expense of lymphoid cells and erythrocytes. Furthermore, proinflammatory cytokines inhibit steady-state erythropoiesis, which leads to the development of anemia in diseases with chronic inflammation. Acute anemia or hypoxic stress induces stress erythropoiesis, which generates a wave of new erythrocytes to maintain erythroid homeostasis until steady-state erythropoiesis can resume. Although hypoxia-dependent signaling is a key component of stress erythropoiesis, we found that inflammation also induced stress erythropoiesis in the absence of hypoxia. Using a mouse model of sterile inflammation, we demonstrated that signaling through Toll-like receptors (TLRs) paradoxically increased the phagocytosis of erythrocytes (erythrophagocytosis) by macrophages in the spleen, which enabled expression of the heme-responsive gene encoding the transcription factor SPI-C. Increased amounts of SPI-C coupled with TLR signaling promoted the expression of Gdf15 and Bmp4, both of which encode ligands that initiate the expansion of stress erythroid progenitors (SEPs) in the spleen. Furthermore, despite their inhibition of steady-state erythropoiesis in the bone marrow, the proinflammatory cytokines TNF-α and IL-1β promoted the expansion and differentiation of SEPs in the spleen. These data suggest that inflammatory signals induce stress erythropoiesis to maintain erythroid homeostasis when inflammation inhibits steady-state erythropoiesis.


Figures

Fig. 1.
Fig. 1.. Zymosan activates stress erythropoiesis by stimulating Gdf15, Bmp4, and Epo expression.
(A) Schematic of the LPS-zymosan model of sterile inflammation. (B) Splenocytes were harvested at the indicated time points and plated at a concentration of 1 × 10⁵ cells per well in the presence of GDF15, BMP4, SCF, SHH, and EPO at low O2 to induce the formation of stress BFU-Es. Stress BFU-Es were scored after 5 days by staining with benzidine. Data represent the mean ± SEM, one-way ANOVA with Dunnett’s multiple comparison test, n = 4 to 11 mice per time point. (C) Flow cytometry analysis of splenocytes was performed at 0 and 36 hours after treatment with zymosan. Cells were gated on Kit+ cells, and frequencies of CD34+ and CD133+ populations are shown in representative images. n = 3 to 5 mice per time point. (D and E) RNA was isolated from splenocytes at the indicated time points after zymosan injection, and relative expression of Gdf15 and Bmp4 compared to 18S was determined by quantitative PCR. Data represent the mean ± SEM, one-way ANOVA with Dunnett’s multiple comparison test, n = 3 to 10 mice per time point. (F) Splenocytes harvested from mice at the indicated time points after zymosan treatment were plated under conditions to induce stress BFU-Es and stained with benzidine and counted after 5 days. Data represent the mean ± SEM, one-way ANOVA with Dunnett’s multiple comparison test, n = 3 to 9 mice per time point. (G) Protein was isolated from kidneys at the indicated time points after zymosan treatment and Western blotted for HIF-2α and β-actin. HIF-2α abundance relative to β-actin was calculated using ImageJ. Data represent the mean ± SEM, one-way ANOVA with Dunnett’s multiple comparison test, n = 3 mice per time point. (H) Quantification of Epo expression relative to 18S in RNA isolated from kidneys and abundance of EPO in serum at the indicated time points after zymosan treatment. Data represent the mean ± SEM, one-way ANOVA with Dunnett’s multiple comparison test, n = 2 to 5 mice per time point (mRNA) and 2 to 8 mice per time point (protein). *P < 0.05, **P < 0.01, and ***P < 0.005.
Fig. 2.
Fig. 2.. Zymosan-induced inflammation results in an influx of new erythrocytes into circulation and lessens the severity of anemia.
(A) Wild-type (WT) mice were treated with either PBS or zymosan as described. The frequency of reticulocytes in the blood at the indicated time points was measured by flow cytometry after staining with thiazole orange. Data represent the mean ± SEM. Two-way ANOVA, n = 4 to 22 mice per group per time point. (B) Quantification of reticulocytes and stress BFU-Es after treatment with zymosan. Data were centered and scaled, and significance was determined using a two-way ANOVA, n = 3 to 22 mice per group per time point. (C) Quantification of reticulocytes in the blood of WT and f/f mice treated with zymosan as measured by flow cytometry after staining with thiazole orange. Data represent the mean ± SEM. Two-way ANOVA, n = 10 to 22 mice per group per time point. (D and E) Mice were injected with biotin for three consecutive days to label all circulating erythrocytes before treatment with zymosan or PBS. Blood was collected every other day thereafter, and in vivo biotinylation was measured by flow cytometry. Data represent the mean ± SEM. Two-way ANOVA, n = 4 to 19 per group per time point. (F) Blood was collected in heparin-coated microcapillary tubes after zymosan treatment and spun to determine hematocrit values. Data represent the mean ± SEM. n = 2 to 10 mice per group per time point. *P < 0.05, **P < 0.01, and ***P < 0.005.
Fig. 3.
Fig. 3.. Zymosan reduces Sirpα on the surface of macrophages and stimulates erythrophagocytosis.
(A) Splenocytes were isolated at the indicated time points after zymosan treatment, and the fraction of F4/80+ cells (macrophages) that had Sirpα on the cell surface was measured by flow cytometry. Percentages of SIRPα+ cells were normalized to 0 min for each experiment. Data represent the mean ± SEM, one-way ANOVA with Dunnett’s multiple comparison test, n = 3 to 4 independent biological replicates. (B) Schematic depicting experimental design of CFSE+ blood transfusion. RPM, red-pulp macrophage. (C and D) Quantification of CFSE+ cells in blood and spleen from PBS- and zymosan-treated mice by flow cytometry at 3 hours (C) or 24 hours (D) after treatment. The spleen samples were gated on F4/80+ cells (macrophages); F4/80+ CFSE+ cells represent macrophages that had phagocytosed CFSE+ erythrocytes. Data represent the mean ± SEM, Student’s t test, n = 3 to 8 mice per condition. *P < 0.05, **P < 0.01, and ***P < 0.005.
Fig. 4.
Fig. 4.. Increased intracellular heme due to erythrophagocytosis drives changes in heme-dependent gene expression.
(A to C) RNA was isolated from splenocytes at the indicated times after zymosan treatment. The expression of Hmox1 (A), Flvcr (B), and Spic (C) was measured relative to 18S. Data represent the mean ± SEM, one-way ANOVA with Dunnett’s multiple comparison test. n = 4 to 7 mice per time point (Hmox1 and Flvcr); n = 3 to 8 mice per time point (Spic). (D) Representative Western blot and quantification of BACH1 abundance in the spleen at the indicated time points after zymosan treatment. β-Actin is included as a loading control and was used for calculating the relative abundance of BACH1 using ImageJ software. Data represent the mean ± SEM, one-way ANOVA with Dunnett’s multiple comparison test, n = 3 mice per time point. (E and F) Splenocytes from mice transfused with CFSE-labeled erythrocytes were sorted into F4/80+CFSE and F4/80+CFSE+ populations 3 hours after zymosan treatment. Expression of Spic and Gdf15 was measured relative to 18S in RNA isolated from each population. Data represent the mean ± SEM. Student’s t tests were performed on log scale–transformed data. n = 4 mice per group. (G) Quantification of the abundance of SIRPα on the surface of bone marrow–derived macrophages (BMDMs) relative to that on unstimulated BMDMs as measured by flow cytometry 1 hour after zymosan treatment with or without the Syk inhibitor piceatannol or the PI3K inhibitor LY294002. All replicates were normalized to 0 min (baseline). Data represent the mean ± SEM. Data were analyzed by one-way ANOVA with Tukey’s multiple comparison test, n = 3 to 6 independent biological replicates. (H) F4/80+CFSE+ populations, representing phagocytosis of CFSE-labeled erythrocytes, were measured by flow cytometry 1 hour after the indicated treatments. Data represent the mean ± SEM. Data were analyzed by one-way ANOVA with Tukey’s multiple comparison test, n = 3 to 6 independent biological replicates. (I) Quantification of Gdf15 expression relative to 18S in BMDMs 3 hours after the indicated treatments. Data represent the mean ± SEM. Data were analyzed by one-way ANOVA with Tukey’s multiple comparison test, n = 3 to 6 independent biological replicates. *P < 0.05, **P < 0.01, and ***P < 0.005.
Fig. 5.
Fig. 5.. Increased erythrophagocytosis and expression of Spic and Gdf15 in response to zymosan depend on MyD88.
(A) BMDMs from WT and MyD88−/− mice were stimulated with LPS and zymosan for 3 hours, and the abundance of surface SIRPα was measured by flow cytometry. SIRPα abundances are indicated as percent of WT unstimulated cells. Data represent the mean ± SEM, one-way ANOVA with Tukey’s multiple comparison test, n = 3 to 8 mice per genotype. (B) BMDMs from WT and MyD88−/− mice were stimulated for 12 hours and then incubated with CFSE-labeled erythrocytes for 1 hour. BMDMs were collected and analyzed by flow cytometry for the presence of CFSE+ cells. Data represent the mean ± SEM, one-way ANOVA with Tukey’s multiple comparison test, n = 3 to 7 independent biological replicates. (C and D) Quantification of the expression of Spic (C) and Gdf15 (D) relative to 18S in from WT and MyD88−/− BMDMs. Data represent the mean ± SEM, one-way ANOVA with Tukey’s multiple comparison test. n = 2 to 4 independent biological replicates (Spic), n = 3 to 7 independent biological replicates (Gdf15). (E and F) Quantification of the expression of Spic (E) and Gdf15 (F) relative to 18S in primary splenocytes incubated for 4 hours with or without JSH-23 to allow for adherence. Adherent cells were treated with zymosan and aged erythrocytes (RBC). Data represent the mean ± SEM. Data were analyzed by one-way ANOVA with Tukey’s multiple comparison test on log scale-transformed data, n = 3 to 6 independent biological replicates. *P < 0.05, **P < 0.01, and ***P < 0.005.
Fig. 6.
Fig. 6.. SPI-C is critical for the induction of Gdf15 and is required for the activation of stress erythropoiesis in response to inflammation.
(A) Percentage of F4/80+ cells in the spleen as determined by flow cytometry. Data represent the mean ± SEM. Student’s t test, n = 3 mice per genotype. (B) WT and Spic−/− mice were treated with LPS, transfused with CFSE-labeled erythrocytes, and treated with zymosan for 3 hours. The frequency of F4/80+CFSE+ cells in the spleen was determined by flow cytometry. Data represent the mean ± SEM. Student’s t test, n = 4 to 7 mice per genotype. (C) Quantification of Gdf15 relative to 18S in F4/80+CFSE and F4/80+CFSE+ cells sorted from the spleen of Spic−/− or control mice. Data represent the mean ± SEM, one-way ANOVA with Tukey’s multiple comparison test performed on log scale–transformed data, n = 3 to 7 mice per population for each genotype. (D) Splenocytes isolated from Spic−/− or control mice were isolated at the indicated times after zymosan treatment and cultured under conditions that induce stress erythropoiesis. Stress BFU-Es were scored by staining with benzidine. Data represent the mean ± SEM. Student’s t test, n = 3 to 5 mice per genotype. (E) Relative frequencies of SIRPα+ BMDMs after zymosan stimulation from Spic−/− and WT mice as measured by flow cytometry and normalized to WT unstimulated control. Data represent the mean ± SEM, one-way ANOVA with Tukey’s multiple comparison test, n = 3 to 5 independent biological replicates. (F) Percentage of CFSE+ cells as measured by flow cytometry in zymosan-stimulated BMDMs 1 hour after the addition of CFSE-labeled erythrocytes. Data represent the mean ± SEM, one-way ANOVA with Dunnett’s multiple comparison test, n = 3 independent biological replicates. (G) Quantification of Gdf15 expression relative to 18S in zymosan-stimulated BMDMs 3 hours after the addition of CFSE-labeled erythrocytes. Data represent the mean ± SEM, one-way ANOVA with Tukey’s multiple comparison test, n = 3 to 5 independent biological replicates. (H) Schematic depicting experimental design of adoptive transfer of purified monocytes and representative flow cytometry plots demonstrating enrichment of the CD11b+Ly6GLy6C+ monocyte population after magnetic bead selection. (I) Analysis of stress BFU-Es in the spleen after monocyte transfer at the indicated times after zymosan treatment. WT (WT mice receiving no monocytes); Spic−/− (Spic−/− mice receiving no monocytes); WT-WT (WT monocytes into WT mice); WT-Spic−/− (WT monocytes into Spic−/− mice); Gdf15−/−-Spic−/− (Gdf15−/− monocytes into Spic−/− mice). Data represent the mean ± SEM, one-way ANOVA with Tukey’s multiple comparison test, n = 3 to 6 mice per group. *P < 0.05, **P < 0.01, and ***P < 0.005.
Fig. 7.
Fig. 7.. TNF-α and IL-1β promote erythroid differentiation in vitro under stress erythropoiesis.
(A to I) Quantification of mRNA expression, percentage of F4/80+ spleen cells positive for protein, and representative flow cytometry diagrams for TNF-α (A to C), IL-1β (D to F), and IFN-γ (G to I) in untreated and zymosan-treated mice. Data represent the mean ± SEM, Student’s t test, n = 4 to 7 mice per group. (J) Percentage increase in number of bone marrow cells cultured with the indicated cytokines. Data represent the mean ± SEM, one-way ANOVA with Dunnett’s multiple comparison test, n=3 to 8 independent biological replicates. (K) Frequency of stress BFU-Es generated after 7 days of culture with the indicated cytokines. Data represent the mean ± SEM, one-way ANOVA with Dunnett’s multiple comparison test, n = 3 to 8 independent biological replicates. (L) Total number of stress BFU-Es generated in cultures with the indicated cytokines. Data represent the mean ± SEM, one-way ANOVA with Dunnett’s multiple comparison test, n = 3 to 8 independent biological replicates. (M) Schematic of the signaling events that occur during the activation of stress erythropoiesis in response to inflammation. *P < 0.05, **P < 0.01, and ***P < 0.005.

Similar articles

Cited by

References

    1. Jurado RL, Iron, infections, and anemia of inflammation. Clin. Infect. Dis 25, 888–895, (1997). - PubMed
    1. Prakash D, Anemia in the ICU: Anemia of chronic disease vesus anemia of acute illness. Crit. Care Clin 28, 333–343 (2012). - PubMed
    1. Sankaran VG, Weiss MJ, Anemia: Progress in molecular mechanisms and therapies. Nat. Med 21, 221–230 (2015). - PMC - PubMed
    1. Weiss G, Ganz T, Goodnough LT, Anemia of inflammation. Blood 133, 40–50 (2019). - PMC - PubMed
    1. Libregts SF, Gutiérrez L, de Bruin AM, Wensveen FM, Papadopoulos P, van Ijcken W, Ozgur Z, Philipsen S, Nolte MA, Chronic IFN-γ production in mice induces anemia by reducing erythrocyte life span and inhibiting erythropoiesis through an IRF-1/PU.1 axis. Blood 118, 2578–2588 (2011). - PubMed

Publication types

MeSH terms

LinkOut - more resources