. 2019 Sep 10;10(1):4096.
doi: 10.1038/s41467-019-11934-y.

Different brain networks mediate the effects of social and conditioned expectations on pain

Affiliations

Different brain networks mediate the effects of social and conditioned expectations on pain

Leonie Koban et al. Nat Commun. .

Abstract

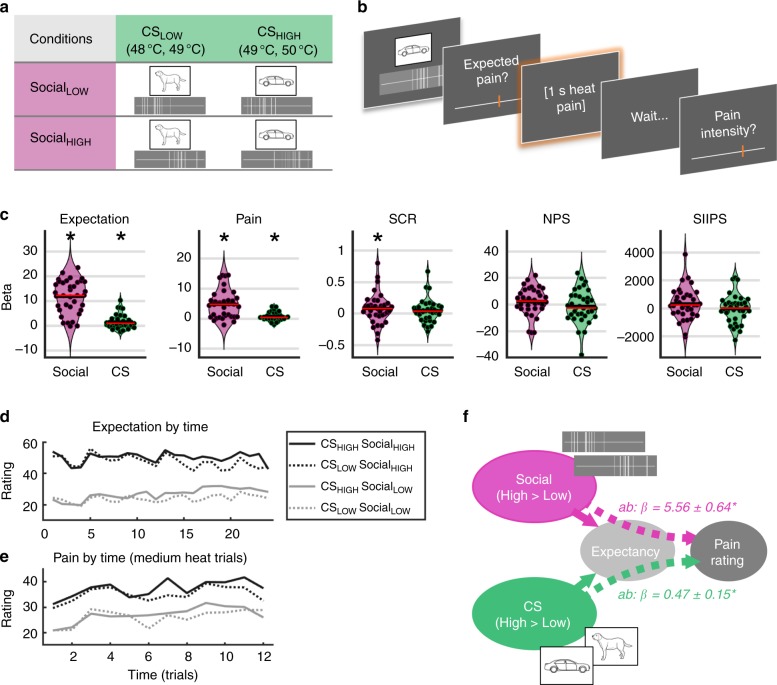
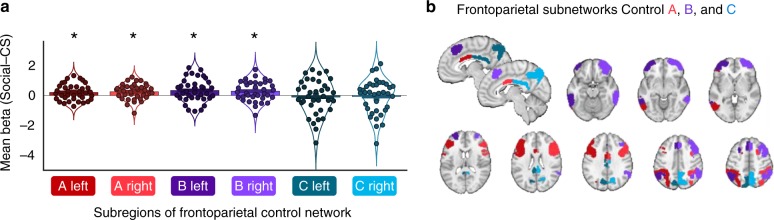
Information about others' experiences can strongly influence our own feelings and decisions. But how does such social information affect the neural generation of affective experience, and are the brain mechanisms involved distinct from those that mediate other types of expectation effects? Here, we used fMRI to dissociate the brain mediators of social influence and associative learning effects on pain. Participants viewed symbolic depictions of other participants' pain ratings (social information) and classically conditioned pain-predictive cues before experiencing painful heat. Social information and conditioned stimuli each had significant effects on pain ratings, and both effects were mediated by self-reported expectations. Yet, these effects were mediated by largely separable brain activity patterns, involving different large-scale functional networks. These results show that learned versus socially instructed expectations modulate pain via partially different mechanisms-a distinction that should be accounted for by theories of predictive coding and related top-down influences.


Conflict of interest statement

The authors declare no competing interests.

Figures

Fig. 1
Fig. 1
Design and results. a Design. The social information could be either low or high on average (SocialLOW or SocialHIGH), but was not correlated with actual heat intensity. In contrast, the learning cues (CSLOW and CSHIGH,) were followed by low-to-medium or medium-to-high heat intensity, respectively. b Each trial started with the simultaneous presentation of social information (“pain ratings of previous participants”, depicted as vertical lines on a VAS) and one of the CS (animal or vehicle drawing). Participants then rated their pain expectation, received a short heat pain stimulation, and rated how much pain they experienced. c Effects on behavior, physiology, and brain patterns. Violinplots show the effects for SocialHIGH > SocialLOW and CSHIGH > CSLOW. Each dot reflects the beta (effect magnitude) estimate of one participant. Both social information and CS significantly influenced expectation (social information: t(35) = 10.65, p < 0.001, CS: t(35) = 3.02, p = 0.005) and pain ratings (social: t(35) = 6.19, p < 0.001, CS: t(35) = 3.13, p = 0.003). Skin conductance responses (SCR) were significantly modulated by social information (t(35) = 2.04, p = 0.049), but not by CS. Neither NPS nor SIIPS showed significant responses to social information or CS. Asterisks denote significant effects at p < 0.05 (using t tests). d, e Time course of expectation and pain ratings. The difference between dotted and solid lines reflects the CS effect, and the difference between gray and black lines the social information effect. CS effects on expectation and pain increased over time (interaction effects CS*Time on expectation: t(35) = 3.02, p = 0.004, on pain: t(35) = 2.03, p = 0.049). Social information effects on expectations and pain remained significant throughout the experiment, but decreased over time for expectation ratings (Social × Time on expectations: t(35) = −4.57, p < 0.001). The x-axis shows trials per condition. f Behavioral mediation analysis. Expectation ratings significantly mediated both Social (t(35) = 8.56, p < 0.001) and CS effects on pain (t(35) = 3.27, p < 0.001). Source data for panels c, d, and e are provided as a Source Data file
Fig. 2
Fig. 2
Whole brain mediation analysis. a Overview. A mass-univariate mediation analysis was performed to identify: (1) activity increases for high > low social information and CS (Path a), (2) activity associated with increased pain ratings when controlling for path a effects (path b), and (3) activity formally mediating the effects of social information and CS on pain ratings (dashed arrows, path ab). b Path b effects. Significant pain-related activity independent of the experimental manipulations was found in mid cingulate, posterior and mid insula, thalamus, cerebellum, and other regions. The wedge plot (with the radius of each wedge proportional to the correlation strength) indicates a high spatial correlation of this effect with the Somatomotor network (Pearson correlation coefficient r = 0.28, see Supplementary Table 6). The ten most strongly associated Neurosynth terms are shown on the right (decreasing brightness indicates order of associations, see Supplementary Table 7). c Path a effects for Social (purple), CS effects (green), and their conjunction (blue). Social information effects (increased activity for SocialHIGH > SocialLOW) were found in ACC, anterior insula, dlPFC, and parietal areas. Those effects most strongly mapped on the frontoparietal (r = 0.13) and dorsal attention networks (r = 0.12, see wedge plot and Supplementary Table 6) and were associated with terms reflecting cognitive tasks (see Supplementary Table 7). CS effects (CSHIGH > CSLOW) were seen in limbic areas and cerebellum, and showed a more diffuse mapping on large-scale networks and meta-analytic terms. d Path ab effects for Social (purple), CS effects (green), and their conjunction (blue). Social influence effects on pain mapped on the frontoparietal and dorsal attention networks (both r’s = 0.06) and on terms associated with cognitive control. CS effects mapped on the default mode network (r = 0.06) and were associated with terms related to semantic processing. All maps were thresholded at FDR q < 0.05 corrected for multiple comparisons across the whole brain (gray matter masked) with adjacent areas thresholded at p < 0.01 and p < 0.05 (uncorrected) for display
Fig. 3
Fig. 3
Conjunction of path a and ab effects. a Social information effects were consistent across paths a and ab in dmPFC, vlPFC, dlPFC, IPS, and visual cortex. Trial-wise average activity (betas) in these regions correlated significantly with trial-wise expectation ratings (individual slopes in purple). Average activity did not significantly predict individual differences in the social influence effects on expectations (scatter plot). b CS effects were consistent across paths a and ab in the hippocampus, cerebellum, and fusiform gyrus. Trial-wise average activity in these areas correlated significantly with trial-wise expectation ratings (individual slopes in green). Individual differences in the strength of the activation were correlated with individual differences in how much expectations ratings were driven by the CS. Conjunction effects are displayed as the intersection of activation for paths a and ab, each of them thresholded at P < 0.05 FDR-corrected and adjacent voxels at p < 0.05 uncorrected. Asterisk reflects significant Pearson correlation coefficient (p < 0.05). Shaded error bands reflect bootstrapped 95% confidence intervals. Source data are provided as a Source Data file
Fig. 4
Fig. 4
Difference between Social and CS effects in frontoparietal control subnetworks. a Difference in mean path a beta weight (Social–CS) in Control A (dark and bright red), Control B (dark and bright purple), and Control C (dark and bright blue) subnetworks in the left and right hemisphere (dark and bright colors, respectively). Each dot reflects the difference in mean beta estimates of one participant. Significantly greater activation for social information was found in the Control A (left: t(35) = 2.3, p = 0.027, 95% CI = [0.03, 0.39], Cohen’s d = 0.38; right: t(35) = 2.9, p = 0.006, 95% CI = [0.08, 0.43], Cohen’s d = 0.48) and the Control B (left: t(35) = 2.6, p = 0.012, 95% CI = [0.08, 0.59], Cohen’s d = 0.44; right: t(35) = 2.6, p = 0.013, 95% CI = [0.07, 0.51], Cohen’s d = 0.44), but not in the Control C network. Asterisks denote networks with significant differences between social information and CS effects (using t-tests, p < 0.05). Source data are provided as a Source Data file. b Display of frontoparietal control subnetworks A (dark and bright red), B (dark and bright purple), and C (dark and bright blue) on sagittal and transversal brain slices
Fig. 5
Fig. 5
Voxel-level spatial covariation in Social and CS mediation (path ab) effects. Scatter plots display unthresholded single-voxel beta weights for CS (y-axis) and Social (x-axis) mediation effects (path ab). Each dot represents a voxel. Different colors are assigned to eight octants that reflect positive mediation for CS but not Social effects (Octant 1), positive mediation effects for both (Octant 2), positive mediation of Social, but not CS effects (Octant 3), and so on. Radial grids display distance from the origin (0,0) in 0.02 unit steps. These maps are descriptive, unthresholded illustrations of mediation beta weights. Units are arbitrary. a Voxel-level similarity in the frontoparietal network, showing the highest sum of squared distances (SSD, displayed in bar plots) from the origin in Octants 2 and 3, reflecting shared (CS and Social) positive and uniquely positive mediation of Social effects, respectively. Voxels in Octants 1–3 (green, blue, and purple, respectively) within the frontoparietal network (light gray area) are displayed on a lateral brain surface plot (far right). b Voxel-level similarity in the limbic network, showing highest SSD in Octants 1 and 8 (see bar plot), reflecting selective mediation of CS effects and suppression of Social effects. Suppression effects are in the opposite direction from, and thus “work against”, the overall effects of cues on pain ratings. Voxels in Octants 1–3 (green, blue, and purple, respectively) in the limbic network (light gray area) are plotted on a medial brain surface (far right). See Supplementary Fig. 6 for the results in all seven large-scale networks. Source data are provided as a Source Data file

Similar articles

Cited by

References

    1. Knill DC, Pouget A. The Bayesian brain: the role of uncertainty in neural coding and computation. Trends Neurosci. 2004;27:712–719. doi: 10.1016/j.tins.2004.10.007. - DOI - PubMed
    1. Friston K. The free-energy principle: a unified brain theory? Nat. Rev. Neurosci. 2010;11:127–138. doi: 10.1038/nrn2787. - DOI - PubMed
    1. Summerfield C, de Lange FP. Expectation in perceptual decision making: neural and computational mechanisms. Nat. Rev. Neurosci. 2014;15:745–756. doi: 10.1038/nrn3838. - DOI - PubMed
    1. Crum A, Zuckerman B. Changing mindsets to enhance treatment effectiveness. JAMA. 2017;317:2063–2064. doi: 10.1001/jama.2017.4545. - DOI - PMC - PubMed
    1. Wager TD, Atlas LY. The neuroscience of placebo effects: connecting context, learning and health. Nat. Rev. Neurosci. 2015;16:403–418. doi: 10.1038/nrn3976. - DOI - PMC - PubMed

Publication types