. 2019 Sep 10;10(1):4095.
doi: 10.1038/s41467-019-12098-5.

A GABAergic and peptidergic sleep neuron as a locomotion stop neuron with compartmentalized Ca2+ dynamics

Affiliations

A GABAergic and peptidergic sleep neuron as a locomotion stop neuron with compartmentalized Ca2+ dynamics

Wagner Steuer Costa et al. Nat Commun. .

Abstract

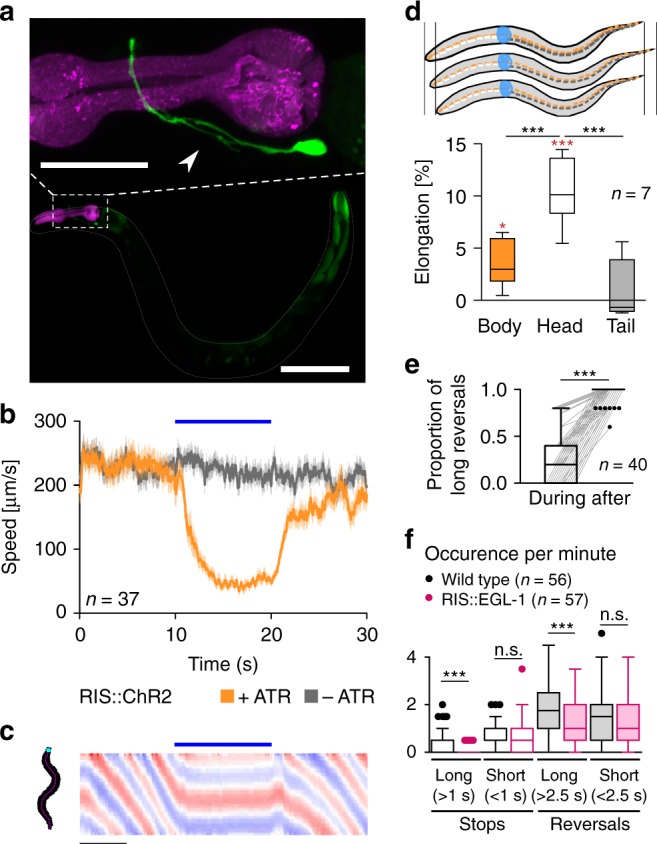
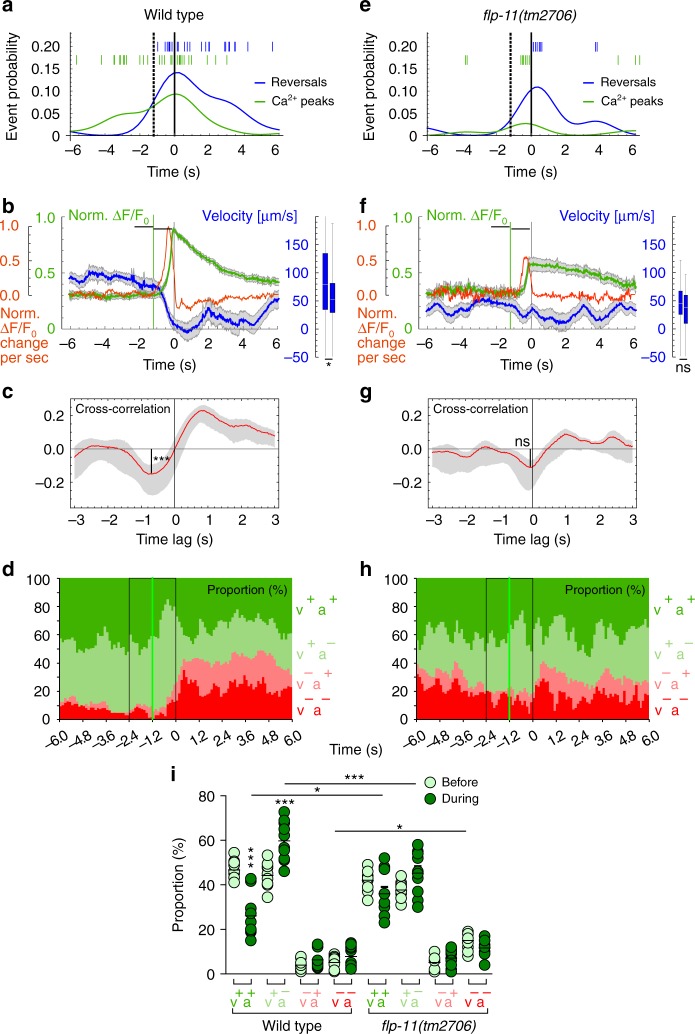
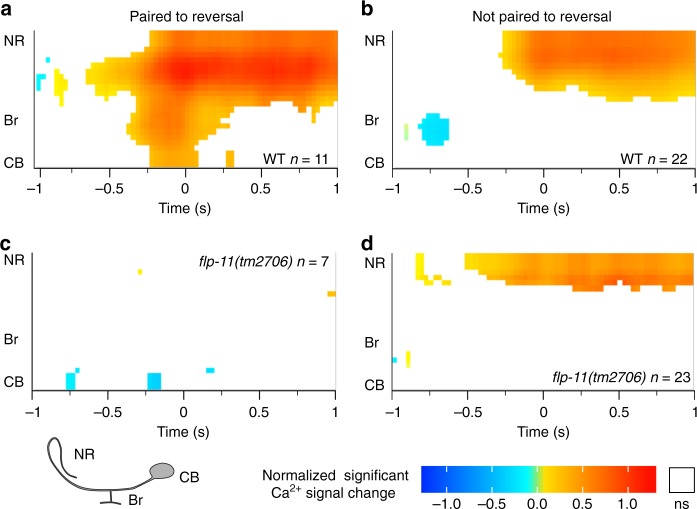
Animals must slow or halt locomotion to integrate sensory inputs or to change direction. In Caenorhabditis elegans, the GABAergic and peptidergic neuron RIS mediates developmentally timed quiescence. Here, we show RIS functions additionally as a locomotion stop neuron. RIS optogenetic stimulation caused acute and persistent inhibition of locomotion and pharyngeal pumping, phenotypes requiring FLP-11 neuropeptides and GABA. RIS photoactivation allows the animal to maintain its body posture by sustaining muscle tone, yet inactivating motor neuron oscillatory activity. During locomotion, RIS axonal Ca2+ signals revealed functional compartmentalization: Activity in the nerve ring process correlated with locomotion stop, while activity in a branch correlated with induced reversals. GABA was required to induce, and FLP-11 neuropeptides were required to sustain locomotion stop. RIS attenuates neuronal activity and inhibits movement, possibly enabling sensory integration and decision making, and exemplifies dual use of one cell across development in a compact nervous system.


Conflict of interest statement

The authors declare no competing interests.

Figures

Fig. 1
Fig. 1
Photo-depolarization of the RIS neuron inhibits locomotion. a Maximum intensity projection showing single-cell GFP expression in RIS. The pharynx expressing mCherry is shown in magenta. Scale bar = 100 µm. Inset: Enlarged head region. Arrowhead: RIS axonal branch region. Scale bar = 25 µm. b Mean locomotion speed before, during, and after RIS::ChR2 photoactivation (blue bar). Data: mean ± SEM; n animals, cultivated with or without ATR, as indicated. c Kymographic representation of bending angles along the spine of a single animal (top: head, bottom: tail, blue to red scale encodes the ventral to dorsal bending). Scale bar is 5 s, blue bar indicates illumination. d Analysis of anterior or posterior body elongation during RIS photoactivation, demarcated by a dot painted on the body of the animal (pictogram: blue paint; dotted lines represent entire body (orange), head (white), or tail (gray) lengths along body mid line) in comparison to whole-body analysis. Boxplot with Tukey whiskers; comparisons are to the no light condition (red asterisks) or between body regions (black asterisks). e Fraction of reversals larger than one body length after mechanical stimulation to the head region during and after RIS photoactivation. Each animal was tested five times during both conditions (N = 40). f Frequency of long and short (shorter or longer than 1 s or 2.5 s, respectively) stops and reversals was compared in wild-type animals, as well as in animals lacking RIS due to expression of the apoptosis-inducer EGL-1. Boxplot with Tukey whiskers. n = number of animals. ***p ≤ 0.001; *p ≤ 0.05; statistical significance tested by one-way ANOVA with Tukey Multiple Comparison test in d and Wilcoxon matched pairs test in e, as well as by unpaired T test in f
Fig. 2
Fig. 2
RIS photoactivation stopped muscular Ca2+-dynamics. a Maximum intensity projection of RCaMP imaging in BWM cells of an immobilized animal (arrow: pharynx, pmyo-2::mCherry marker). Boxed regions: Violet, blue: regions of interest for dorso-ventrally alternating activity; white: region of interest for kymographic analysis of dorsal muscle Ca2+ signals along the body in c, scale bar = 100 µm, A, P, V, D: anterior, posterior, ventral, dorsal, respectively. b Ca2+ dynamics in both regions of interest from a (V = ventral, D = dorsal muscle cells) measured before, during, and after RIS::ChR2 photostimulation, denoted by the blue bar. F0 defined as the mean RCaMP intensity during the first 4.5 s of the recording. c Kymograph representation of the Ca2+ dynamics along the dorsal side. The RCaMP signal was normalized for visualization purposes. RIS photoactivation: blue bar. Scale bar = 10 s. d Example of the RCaMP signal autocorrelation for a specific point in the BWM over time, before, during, and following illumination. Ventral and dorsal BWMs were analyzed. Red lines: Peak autocorrelation of two consecutive Ca2+ waves and their time lag (if no consecutive Ca2+ signals were detected during the stimulation period, stimulus duration was taken as lower bound). e Distribution of the mean change in the muscular Ca2+ oscillation period per animal, compared to before RIS photoactivation. When no oscillations occurred, the duration of photostimulation (20 s) was assumed as minimal period. Compared are animals without and with ATR, number of animals indicated in gray numbers. ***p ≤ 0.001; **p ≤ 0.01; statistical significance tested by ANOVA, Bartlett’s test, and Bonferroni’s multiple comparison test
Fig. 3
Fig. 3
RIS photoactivation suppressed motor neuron (MN) synchrony and Ca2+ oscillations. a Exemplary voltage clamp recording of BWM cell, postsynaptic to MNs. Blue bar denotes RIS::ChR2 photostimulation b, c Analysis (mean ± SEM) of mPSC frequency (b) and amplitude (c). Blue bar: Illumination period; n = 11 animals. d Fourier transform with multi-taper analysis of mPSC events across the observed frequencies. Mean (solid lines) ± SEM (dashed lines) of the periods before, during, and after RIS photostimulation of n = 11 animals. e RCaMP fluorescence in cholinergic neurons in the head with region of interest from dorsal nerve ring (NR; d and v denote dorsal and ventral portions in f) through ventral to retrovesicular ganglia (VG, RVG) marked in white; black: pharynx outline. Scale bar = 25 µm. For identity of cells imaged, see Supplementary Fig. 3A. f Kymograph representation of cholinergic neuron Ca2+ dynamics from the dorsal NR to posterior RVG. Scale bars, upper = 20 s, lower = 10 s; blue bar: illumination period, lower three panels show expanded views. g Autocorrelation analysis (as in Fig. 2e); distribution of mean change in Ca2+ oscillation period in cholinergic neurons, per animal, relative to before RIS photoactivation. When no oscillations occurred, the duration of photostimulation (60 s) was assumed as minimal period. Number of animals indicated in gray. ***p ≤ 0.001; **p ≤ 0.01; *p ≤ 0.05; statistical significance tested by two-way ANOVA in d and ANOVA, Bartlett’s test, and Bonferroni’s multiple comparison test in g
Fig. 4
Fig. 4
The stop phenotype induced by RIS photoactivation requires GABA and neuropeptide signaling. a Animal locomotion analyzed before, during, and after photoactivation of RIS (in lite-1(ce314) background, to eliminate unspecific photophobic responses) and the proportion of animals in distinct state (forward (green), stop (white), reversal (magenta)) deduced from the animal velocities is represented in color, over time, across all animals analyzed (number of animals and genotypes indicated above each data set). Significant change in stop proportion during RIS photoactivation versus WT indicated; blue bar and blue shade: illumination period; scale bar: 2 s. b Relative body elongation during RIS photoactivation; box plot with Tukey whiskers, numbers of animals, and genotypes are indicated below. c, d Mean ± SEM locomotion speed (c) or body length (d) before, during, or after photoactivation of RIS::ChR2 (blue bars) compared in egl-3(gk238) mutants raised with or without ATR. Number of animals depicted in gray. e Mean normalized angular velocity in anterior quarter of the animal for WT and unc-9(e101) mutants expressing RIS::ChR2, with and without ATR. Box plot with Tukey whiskers. ***p ≤ 0.001; **p ≤ 0.01; *p ≤ 0.05; ns: non-significant; statistical significance tested by ANOVA, Kruskal–Wallis with Dunn’s Multiple Comparison Test in (a; black, versus WT in b, e) or Wilcoxon Signed Rank Test, versus no body length change (red, in b)
Fig. 5
Fig. 5
Ca2+ activity measured along the RIS axon in freely moving animals correlates with slowing and reversals: a Strain used for tracking and Ca2+ imaging RIS in moving animals, expressing a red fluorescent marker in the pharyngeal terminal bulb (for tracking) and GCaMP6s in RIS. Micrographs of red (II) and green (III) fluorescence and merged color channels (I). Scale bar: 50 µm. b Image analysis after binarization and repositioning the soma involved reorienting the raw image (I), masking unspecific gut fluorescence (II), fitting a parabola (III), and measuring fluorescence intensity in perpendicular rectangular ROIs (IV). Dorsal is up, anterior to the left; CB cell body, NR nerve ring. c, d Upper panels: Representative traces of animal velocity (blue) and fluorescence intensity in the RIS nerve ring portion (green). Lower panels: Corresponding heat maps displaying the normalized fluorescence dynamics along the axon over time. RIS pictograms on the left indicate morphology including nerve ring (NR), branch (Br), and cell body (CB), the distance along the axon as well as the region of the nerve ring (green box) used for calculating the ΔF/F0 traces in the upper panels, while dashed region shows extent of ROIs analyzed in lower panels (also in e). Distinct Ca2+ rise events in the branch region are boxed. e Mean normalized fluorescence heat map of n = 45 acquired Ca2+ events along the entire length of RIS, partially excluding the soma, by aligning time windows 6 s prior and post Ca2+ peaks (N = 11 animals)
Fig. 6
Fig. 6
RIS Ca2+ activity induces decreased forward locomotion and increased reversal probability, which requires FLP-11 neuropeptides: a Conditional probability density function of the shortest unbiased time lag to a reversal given a Ca2+ peak event (aligned nearest reversal events depicted as blue lines) and vice versa for the probability of a Ca2+ peak event given a reversal (green lines: time lag to the nearest reversal) in WT animals. The dotted vertical line indicates the mean onset of a Ca2+ rise, the black solid line indicates peak Ca2+. b Ca2+ peak-aligned normalized GCaMP intensity (green, mean ± SEM) in the nerve ring region of the RIS axon (as depicted in Fig. 4c) and animal velocity in µm/s (blue, mean ± SEM, n = 45; a significant reduction in the two periods before and during the Ca2+ rise is shown on the right, boxplot, p < 0.001). Shown in red is the mean first derivative (dF/dt rise rate, s−1) of all Ca2+ signals. c Mean ± confidence intervals of time-shifted cross-correlation (red) of animal velocity aligned to Ca2+ signal rise rate, (as in b). Anticorrelation is significantly different from 0 and shows a negative time lag (n = 45, Pearson’s r = −0.15). d Ca2+ peak-aligned analysis of the proportion of the animal population in one of the four behavioral states: 1 moving forward and accelerating (v+a+, positive velocity and acceleration, dark green; for acceleration data, see Supplementary Fig. 6C, D), 2 moving forward and decelerating (v+a, light green), 3 moving backwards, but accelerating (va+, pink), and 4 moving backwards and slowing (va, dark red). Number of reversing animals increased significantly during RIS Ca2+ events (T test, p < 0.001). Green line indicates mean onset of RIS Ca2+ rise. i Scatter plot with means of the data in d, h; statistical differences analyzed for the time periods indicated by black boxes (before and during Ca2+ rise). eh As in ad, but in flp-11(tm2706) background. Boxplots in b, f compare the average in the time windows indicated by black brackets below the traces. ***p ≤ 0.001; *p ≤ 0.05; ns: not significant; statistical significance tested by paired T test in b, f and unpaired T test in c, g; ANOVA with Tukey multiple comparisons test in i
Fig. 7
Fig. 7
Compartmentalized Ca2+ dynamics in the RIS process. a, c Ca2+ events paired to a reversal in the 2 s time window flanking a Ca2+ signal obtained from freely behaving animals (WT in a, flp-11(tm2706) in c). Top is the dorsal nerve ring (NR) region, passing through the branch region (Br) to the center of the cell body (CB). Only events significantly different from inactivity are shown, color coded for intensity, normalized and relative to the mean of the first 150 ms depicted. Blue and red hues indicate significant reductions and increases, respectively. Non-significant dynamics are omitted and shown in white. b, d Ca2+ events unpaired to a reversal in the 2 s time window flanking a Ca2+ signal, as in a, c. Number of events indicated. Significance level: T Test, p < 0.05
Fig. 8
Fig. 8
Models summarizing stimulated and intrinsic activities of RIS and comparison of sleep and stop neurons across model systems. a Fraction of behaviors found in animals before, during, and following optogenetic RIS stimulation (blue bar), categorized as forward (green), stop (gray and white), and reversal (red) movement. Also indicated is the contribution of RIS neurotransmitters to fast and sustained phases of induced stops. b Ca2+ activities of nerve ring and branch regions of the RIS axon, accompanying locomotion behaviors. The nerve ring region is active to induce slowing, while the branch region is additionally active when reversals are induced. c Comparison of stop cells and sleep neurons/systems in various model organisms. Hierarchy indicates complexity of the respective brains but implies no phylogenetic relationships. Left: Cells that stop or slow down locomotion when activated, in C. elegans (RIS), D. melanogaster larvae (PDM-DNs posterior dorso-medial brain lobe descending neurons), X. tropicalis tadpoles (GABAergic MHRs, mid-hindbrain reticulospinal neurons), Tr2 cells in the anterior brain of the leech H. medicinalis, glutamatergic neurons in the MLR (mesencephalic locomotion region) and RS stop cells of the cMRRN (reticulospinal cells of caudal middle rhombencephalic reticular nucleus) of the lamprey P. marinus,, and several types of mammalian stop cells: V2a reticulospinal interneurons in rostral medulla or caudal pons, GABAergic neurons in the MLR, GABAergic and glycinergic neurons in the gigantocellular nucleus (GiA), and glycinergic neurons in the lateral paragigantocellular nucleus (LPGi). No stop cells were identified in zebrafish. Right: Sleep promoting neurons/systems (green: directly, and blue, indirectly promoting sleep, reviewed in ref. ) are peptidergic and GABAergic RIS and ALA cells in C. elegans (thus combining functions of stop and sleep neurons in RIS); in zebrafish larvae RFamide neuropeptide VF (NPVF), similar to C. elegans flp-11 derived peptides, inhibits serotonergic neurons in the ventral raphe nucleus; and in the mouse, GABAergic/peptidergic neurons in the preoptic area (POA), inhibitory neurons of the parafacial zone (PZ) of the brain stem, and GABAergic neurons of the ventral medulla (vM) are involved in sleep control. Transmitters used by each cell type are indicated. No sleep systems are known yet for fly larvae, tadpoles, leech, or lamprey. Animal silhouettes were acquired from http://phylopic.org/

Similar articles

Cited by

References

    1. Vetrivelan R, Chang C, Lu J. Muscle tone regulation during REM sleep: neural circuitry and clinical significance. Arch. Ital. Biol. 2011;149:348–366. - PubMed
    1. Clément O, et al. The lateral hypothalamic area controls paradoxical (REM) sleep by means of descending projections to brainstem GABAergic neurons. J. Neurosci. 2012;32:16763–16774. doi: 10.1523/JNEUROSCI.1885-12.2012. - DOI - PMC - PubMed
    1. Kiehn O. Development and functional organization of spinal locomotor circuits. Curr. Opin. Neurobiol. 2011;21:100–109. doi: 10.1016/j.conb.2010.09.004. - DOI - PubMed
    1. Talpalar AE, et al. Dual-mode operation of neuronal networks involved in left-right alternation. Nature. 2013;500:85–88. doi: 10.1038/nature12286. - DOI - PubMed
    1. Kiehn O. Decoding the organization of spinal circuits that control locomotion. Nat. Rev. Neurosci. 2016;17:224–238. doi: 10.1038/nrn.2016.9. - DOI - PMC - PubMed

Publication types