

Broadband on-chip single-photon spectrometer
- PMID: 31506440
- PMCID: PMC6736971
- DOI: 10.1038/s41467-019-12149-x
Broadband on-chip single-photon spectrometer
Abstract
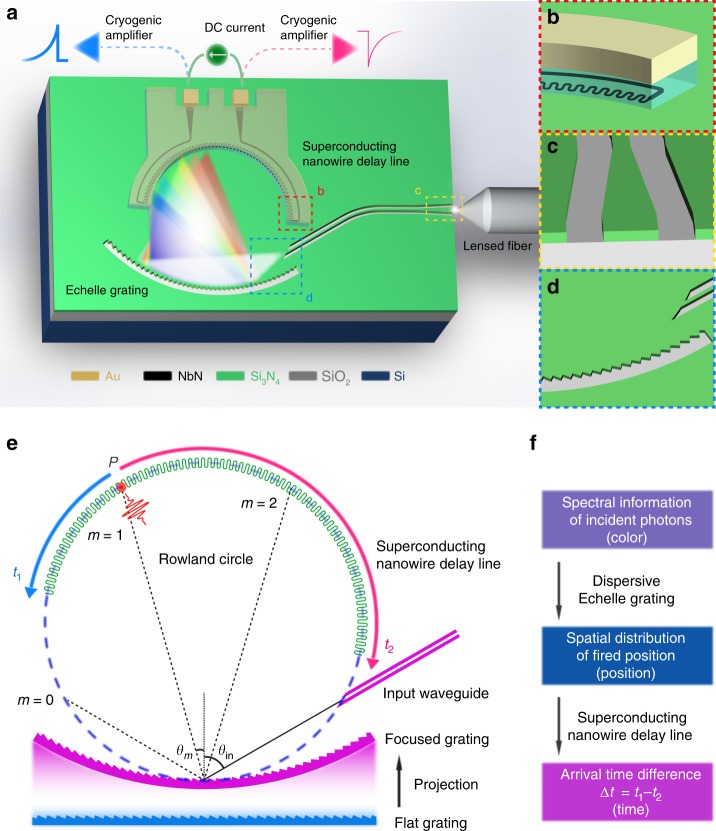
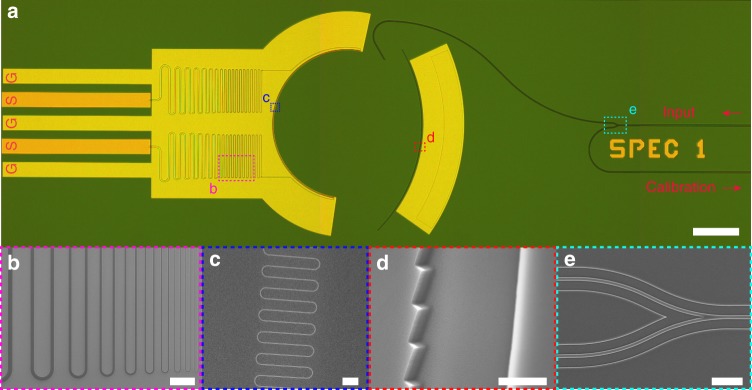
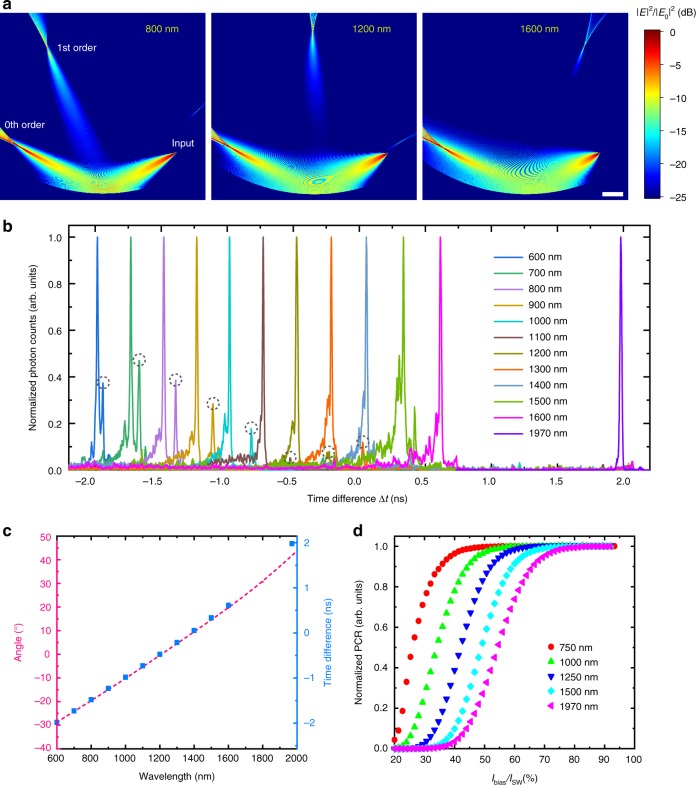
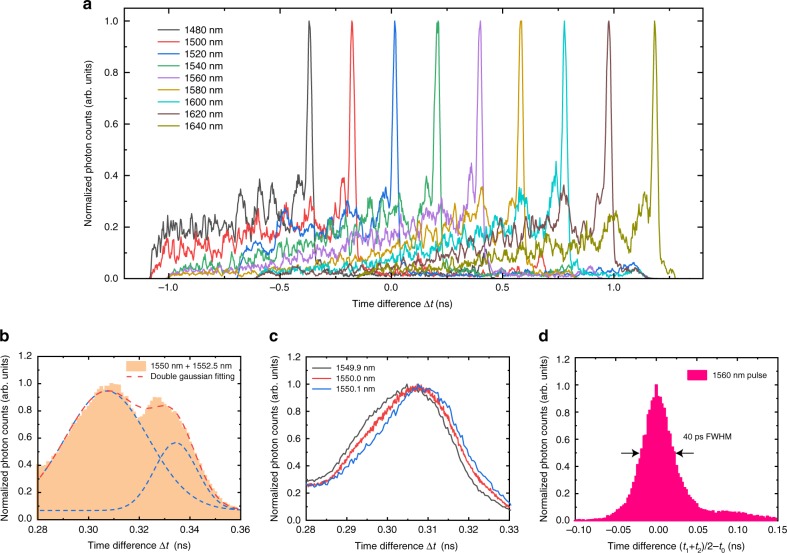
Single-photon counters are single-pixel binary devices that click upon the absorption of a photon but obscure its spectral information, whereas resolving the color of detected photons has been in critical demand for frontier astronomical observation, spectroscopic imaging and wavelength division multiplexed quantum communications. Current implementations of single-photon spectrometers either consist of bulky wavelength-scanning components or have limited detection channels, preventing parallel detection of broadband single photons with high spectral resolutions. Here, we present the first broadband chip-scale single-photon spectrometer covering both visible and infrared wavebands spanning from 600 nm to 2000 nm. The spectrometer integrates an on-chip dispersive echelle grating with a single-element propagating superconducting nanowire detector of ultraslow-velocity for mapping the dispersed photons with high spatial resolutions. The demonstrated on-chip single-photon spectrometer features small device footprint, high robustness with no moving parts and meanwhile offers more than 200 equivalent wavelength detection channels with further scalability.
Conflict of interest statement
The authors declare no competing interests.
Figures
Similar articles
-
Single-Detector Spectrometer Using a Superconducting Nanowire.Nano Lett. 2021 Nov 24;21(22):9625-9632. doi: 10.1021/acs.nanolett.1c03393. Epub 2021 Nov 3. Nano Lett. 2021. PMID: 34730364
-
Broadband Spectrometer with Single-Photon Sensitivity Exploiting Tailored Disorder.Nano Lett. 2020 Apr 8;20(4):2625-2631. doi: 10.1021/acs.nanolett.0c00171. Epub 2020 Mar 16. Nano Lett. 2020. PMID: 32160472
-
Ultra-broadband microfiber-coupled superconducting single-photon detector.Opt Express. 2019 Sep 2;27(18):25241-25250. doi: 10.1364/OE.27.025241. Opt Express. 2019. PMID: 31510399
-
Probabilistic Energy-to-Amplitude Mapping in a Tapered Superconducting Nanowire Single-Photon Detector.Nano Lett. 2022 Feb 23;22(4):1587-1594. doi: 10.1021/acs.nanolett.1c04482. Epub 2022 Feb 7. Nano Lett. 2022. PMID: 35129992
-
Miniaturization of optical spectrometers.Science. 2021 Jan 29;371(6528):eabe0722. doi: 10.1126/science.abe0722. Science. 2021. PMID: 33509998 Review.
Cited by
-
A Review: Laser Interference Lithography for Diffraction Gratings and Their Applications in Encoders and Spectrometers.Sensors (Basel). 2024 Oct 14;24(20):6617. doi: 10.3390/s24206617. Sensors (Basel). 2024. PMID: 39460098 Free PMC article. Review.
-
Heralded Spectroscopy Reveals Exciton-Exciton Correlations in Single Colloidal Quantum Dots.Nano Lett. 2021 Aug 25;21(16):6756-6763. doi: 10.1021/acs.nanolett.1c01291. Epub 2021 Aug 16. Nano Lett. 2021. PMID: 34398604 Free PMC article.
-
Nonlinear memristive computational spectrometer.Light Sci Appl. 2025 Jan 14;14(1):47. doi: 10.1038/s41377-024-01703-y. Light Sci Appl. 2025. PMID: 39809745 Free PMC article.
-
Reconstructive spectrometer using double-layer disordered metasurfaces.Sci Adv. 2025 May 30;11(22):eadv2376. doi: 10.1126/sciadv.adv2376. Epub 2025 May 28. Sci Adv. 2025. PMID: 40435236 Free PMC article.
-
Biosensing with Silicon Nitride Microring Resonators Integrated with an On-Chip Filter Bank Spectrometer.ACS Sens. 2023 Feb 24;8(2):739-747. doi: 10.1021/acssensors.2c02276. Epub 2023 Feb 14. ACS Sens. 2023. PMID: 36787432 Free PMC article.
References
-
- Appenzeller, I. Introduction to Astronomical Spectroscopy, vol. 9 (Cambridge University Press, 2012).
-
- Camp CH, Jr, Cicerone MT. Chemically sensitive bioimaging with coherent raman scattering. Nat. Photonics. 2015;9:295. doi: 10.1038/nphoton.2015.60. - DOI
LinkOut - more resources
Full Text Sources
Other Literature Sources
