. 2019 Sep 10;9(1):13048.
doi: 10.1038/s41598-019-47598-3.

Biological surface properties in extracellular vesicles and their effect on cargo proteins

Affiliations

Biological surface properties in extracellular vesicles and their effect on cargo proteins

Laura Santucci et al. Sci Rep. .

Erratum in

Abstract

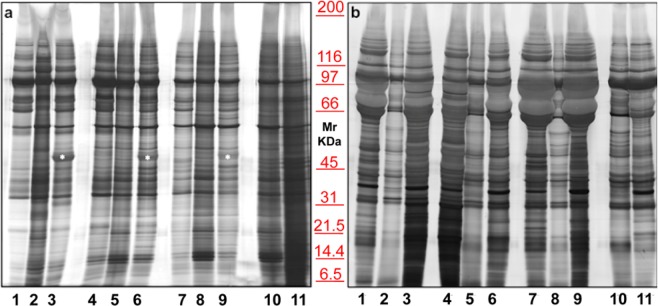
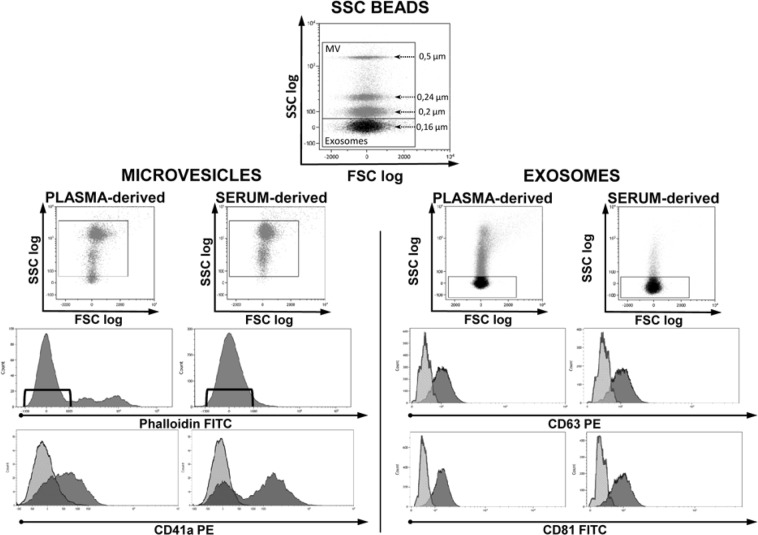
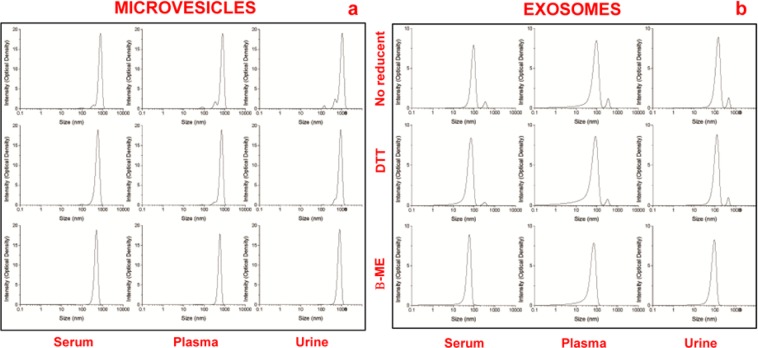
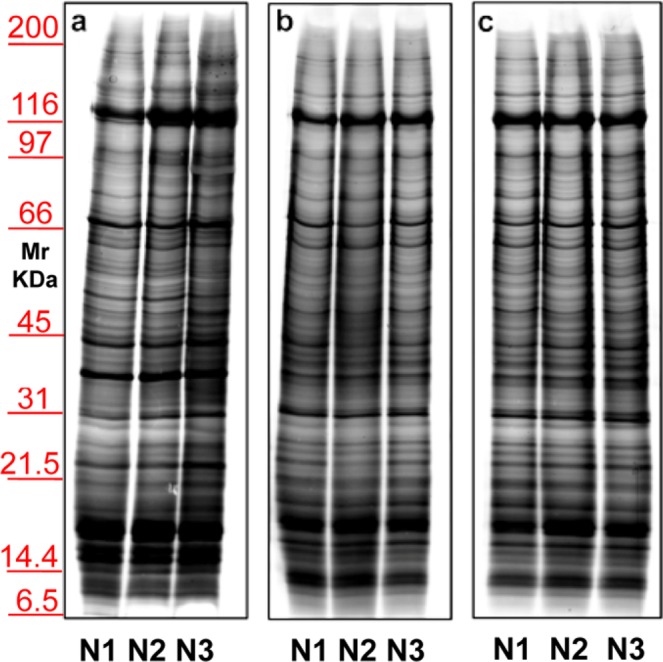
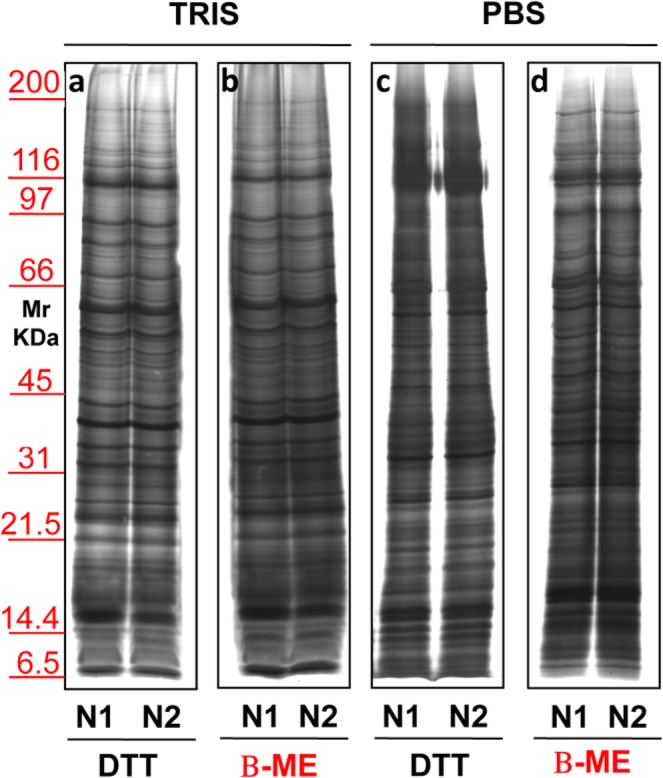
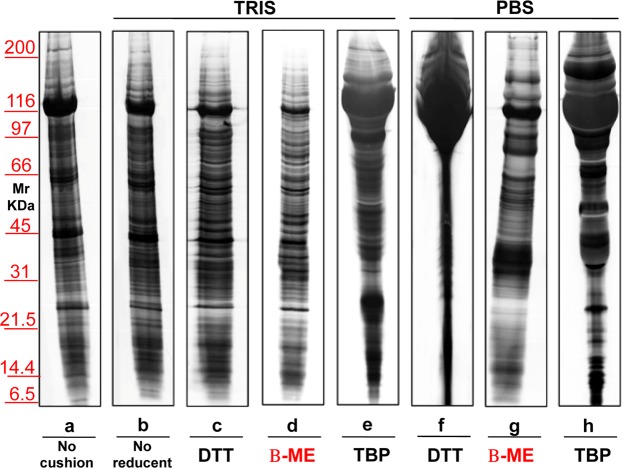
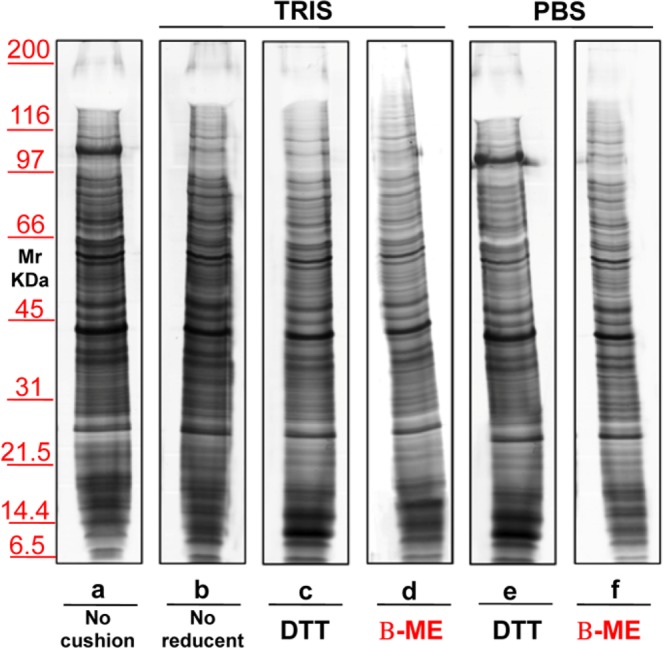
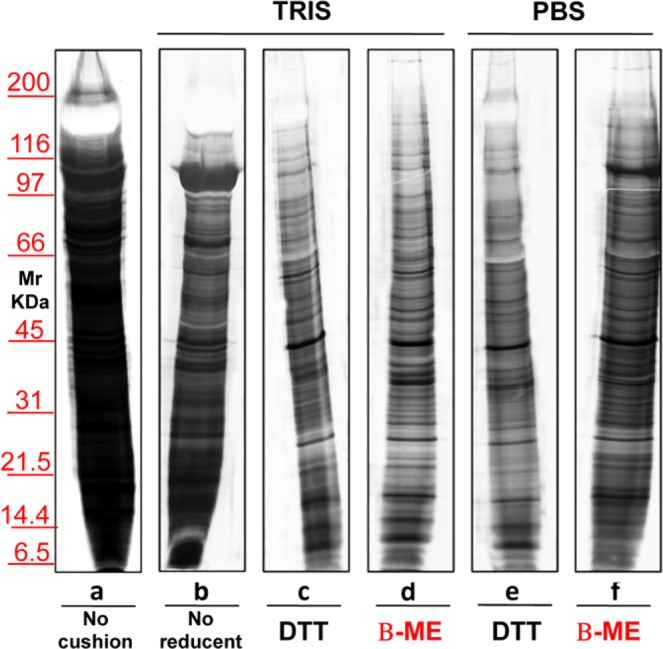
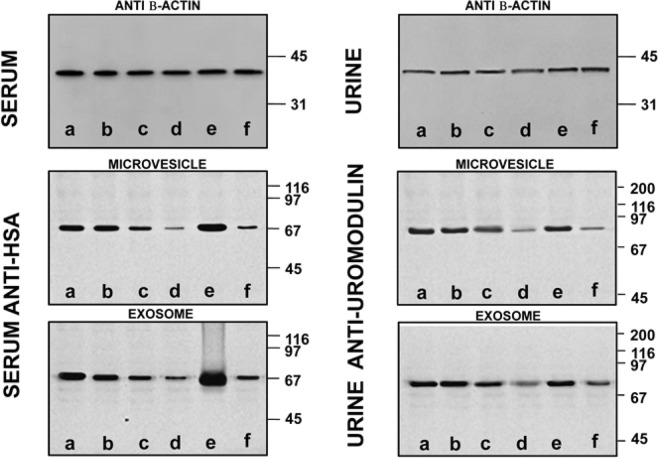
Ultracentrifugationon sucrose density gradientappears to be the best purification protocol for extracellular vesicle (EVs) purification. After this step, to reduce disulfide bridges linking exogenous proteins to the vesicles, the collected samples are routinely washed and treated with dithiothreitol (DTT). Such incubations are performed at temperatures ranging from room temperature up to 95 °C, with either Tris or PBS as buffers. We re-investigated these steps on both exosomes and microvesicles purified from blood (serum) and urine by electrophoretic separation, silver staining and western blots analysis. Data confirm that an extra centrifugation on a sucrose cushion can effectively eliminate contaminants. Tris buffer (50 Mm) and β-mercaptoethanol as a reducing agent at room temperature dramatically improved either sample cleaning. By contrast, especially for exosomes PBS buffer and DTT, above 37 °C, caused massive protein aggregations, yielding blurred SDS-PAGE gels in both samples. Immuno-blot analyses demonstrated that in PBS-DTT contamination with albumin (in serum) or with uromodulin (in urine) occurs. DTT, likely due to its two-SH groups, might form scrambled SS-bonds promoting EVs interaction with environmental macromolecules via disulphide bridges. Therefore, to obtain maximum vesicle purity for biomarker investigations and to maximize both presence of EVs proteins and their accessibility, use of DTT is not recommended.


Conflict of interest statement

The authors declare no competing interests.

Figures

Figure 1
Figure 1
Representative electrophoresis of microvesicles (a) and exosomes (b) obtained from 1 ml of three different EDTA plasma (1, 4, 7), sera (2, 5, 8), sodium citrate plasma (3, 6, 9), serum pool (10) and EDTA plasma pool (11) of healthy donors. SDS-PAGE were performed onto 8–16% T gels. Both gels were visualized by silver staining.
Figure 2
Figure 2
Cytofluorimetric analysis of microvesicles and exosomes obtained from plasma and serum of healthy donors. PB was collected in EDTA tubes. Top dot plot shows SSC beads analyzed by their physical parameters, namely side scatter (SSC) and forward scatter (FSC). Beads allowed to set gates used to define vesicles dimensions. Among events of microvesicular dimension only those negative for Phalloidin were considered MV and further analyzed for CD41a expression (left side dot plots). Considering the small dimensions of exosomes, to analyze their CD63 and CD81 expression (right side dot plots) a fluorescence minus one analysis was performed. CD41a, CD63 and CD81 histograms show both negative (light grey) and positive (dark grey) samples. The experiment is representative of other three.
Figure 3
Figure 3
Representative dynamic light scattering analysis of microvesicles (a) and exosomes (b) obtained from 1 ml of serum/plasma and 12 ml of urine, after sucrose cushion. The graph reports the size (nm) of the particles (x-axis) versus intensity (Optical Density y-axis). The samples visualized in the first row are without reducing agents while those in the second and third row were treated with by DTT and β-ME, respectively.
Figure 4
Figure 4
Representative electrophoresis of microvesicles obtained from 1 ml of three different sera (N1–N3) of healthy donors. Gels are cropped to better highlight the different methods used. Silver staining of samples without (a) or with (b,c) application of sucrose cushions. In panel b incubation was conducted at room temperature, while in (c) incubation was at 37 °C; in both cases the buffer used is Tris. SDS-PAGE was performed onto 8–16% T gels.
Figure 5
Figure 5
Representative electrophoresis of micro-vesicles obtained from 1 ml of two different sera (N1–N2) of healthy donors. Gels are cropped to better highlight the different methods used. Silver staining representative of samples isolated by sucrose cushion centrifugations utilizing as buffer Tris (a,b) or PBS (c,d). In panels a and c samples were added of DTT while those in panel b and d were added of β-ME. SDS-PAGE was performed onto 8–16% T gel.
Figure 6
Figure 6
Representative silver staining of exosomes obtained from 1 ml of serum from healthy donors. Gels are cropped to better highlight the different methods used. Electrophoresis of samples isolated without (a) or with the use of sucrose cushions (bh) utilizing as buffer Tris (be) or PBS (fh). Samples visualized in lanes (c,f) were treated with the addition of DTT, those in (d,g) were added of β-ME, while those in (e,h) were added of TBP. Serum in (b) is without reducing agent. SDS-PAGE was performed onto 8–16% T gels.
Figure 7
Figure 7
Representative silver staining of microvesicles obtained from 12 ml of urine of healthy donors. Gels are cropped to better highlight the different methods used. Electrophoresis without (a) and on a sucrose cushions (bh) utilizing as buffer Tris (be) or PBS (fh). The sample visualized in lanes (c,f) were added of DTT, those in (d,g) of β-ME while those in (e,h) of TBP. Serum in (b) is without reducing agent. SDS-PAGE was performed onto 8–16% T gels.
Figure 8
Figure 8
Representative silver staining of exosomes obtained from 12 ml of urine of normal volunteers. Gels are cropped to better highlight the different methods used. Electrophoresis without (a) and on a sucrose cushions (bf) utilizing as buffer Tris (bd) or PBS (ef). The sample visualized in lane (c,e) is treated with the addition of reducent DTT while in panel d and f of β-ME. In the serum (b) there is no reducing agent. SDS-PAGE was performed onto 8–16% T gels.
Figure 9
Figure 9
Western blot of MVs/EXOs of serum/urine from healthy donors with anti-human monoclonal mouse β-Actin, polyclonal rabbit serum anti-albumin (HSA) or sheep anti-uromodulin from samples isolated without (a) or with sucrose cushions (bf) utilizing as buffer Tris (bd) or PBS (e,f). Samples in (c,e) were added of DTT while those in (d,f) of β-ME. In the serum/urine (b) there is no reducing agent. Gels are cropped to better highlight the results. SDS-PAGE was performed onto 8–16% T gels.

Similar articles

Cited by

References

    1. Simpson RJ, Lim JW, Moritz RL, Mathivanan S. Exosomes: proteomic insights and diagnostic potential. Expert Rev Proteomics. 2009;6:267–283. doi: 10.1586/epr.09.17. - DOI - PubMed
    1. Cocucci E, Racchetti G, Meldolesi J. Shedding microvesicles: artefacts no more. Trends Cell Biol. 2009;19:43–51. doi: 10.1016/j.tcb.2008.11.003. - DOI - PubMed
    1. Lobb RJ, et al. Optimized exosome isolation protocol for cell culture supernatant and human plasma. J Extracell Vesicles. 2015;4:27031. doi: 10.3402/jev.v4.27031. - DOI - PMC - PubMed
    1. Yanez-Mo M, et al. Biological properties of extracellular vesicles and their physiological functions. J Extracell Vesicles. 2015;4:27066. doi: 10.3402/jev.v4.27066. - DOI - PMC - PubMed
    1. Panfoli I, et al. Exosomes from human mesenchymal stem cells conduct aerobic metabolism in term and preterm newborn infants. FASEB J. 2016;30:1416–1424. doi: 10.1096/fj.15-279679. - DOI - PubMed

Publication types