. 2019 Sep 10;9(1):13057.
doi: 10.1038/s41598-019-49440-2.

Transgenerational Self-Reconstruction of Disrupted Chromatin Organization After Exposure To An Environmental Stressor in Mice

Affiliations

Transgenerational Self-Reconstruction of Disrupted Chromatin Organization After Exposure To An Environmental Stressor in Mice

Carlos Diaz-Castillo et al. Sci Rep. .

Abstract

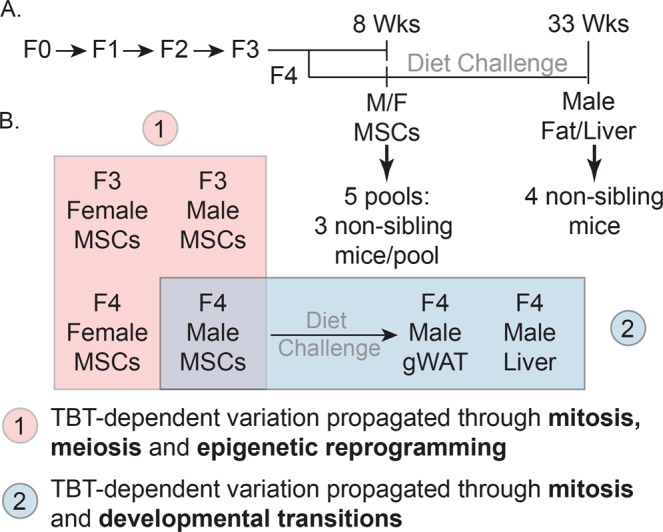
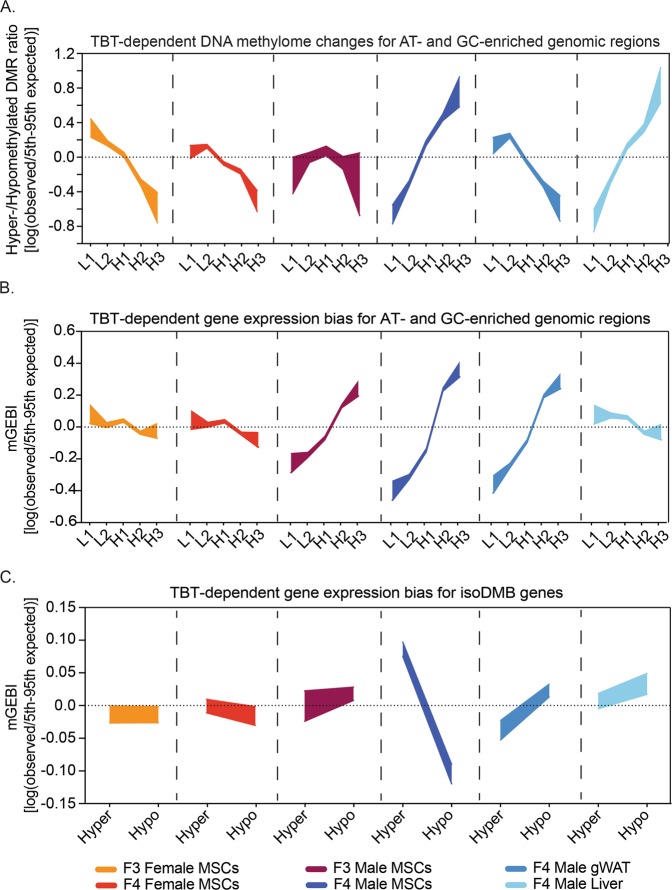
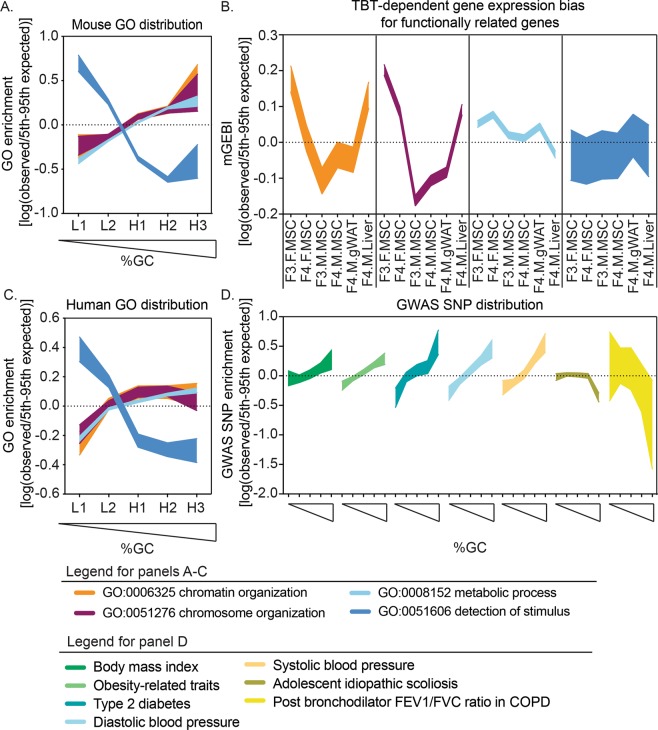
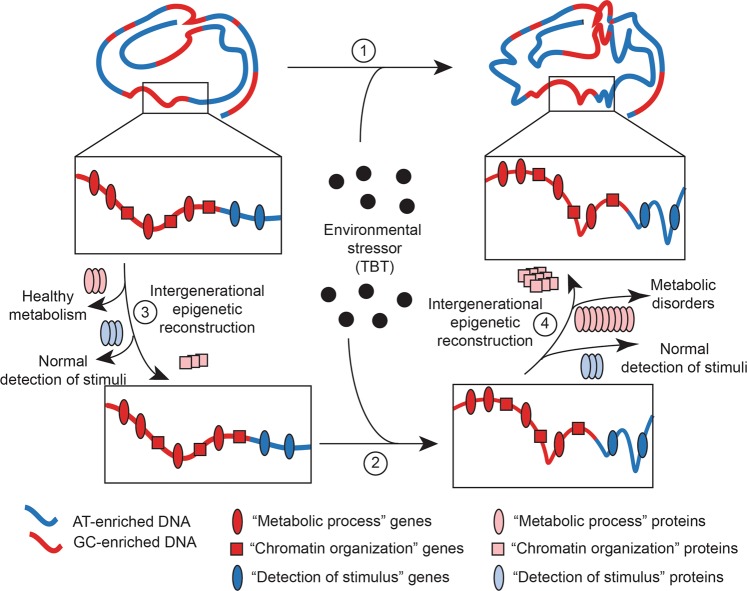
Exposure to environmental stressors is known to increase disease susceptibility in unexposed descendants in the absence of detectable genetic mutations. The mechanisms mediating environmentally-induced transgenerational disease susceptibility are poorly understood. We showed that great-great-grandsons of female mice exposed to tributyltin (TBT) throughout pregnancy and lactation were predisposed to obesity due to altered chromatin organization that subsequently biased DNA methylation and gene expression. Here we analyzed DNA methylomes and transcriptomes from tissues of animals ancestrally exposed to TBT spanning generations, sexes, ontogeny, and cell differentiation state. We found that TBT elicited concerted alterations in the expression of "chromatin organization" genes and inferred that TBT-disrupted chromatin organization might be able to self-reconstruct transgenerationally. We also found that the location of "chromatin organization" and "metabolic" genes is biased similarly in mouse and human genomes, suggesting that exposure to environmental stressors in different species could elicit similar phenotypic effects via self-reconstruction of disrupted chromatin organization.


Conflict of interest statement

B.B. is a named inventor on U.S. patents US 5,861,274, US 6,200,802, US 6,815,168, US 7,250,273, related to PPARγ. C.D.-C., R.C.-G. and T.S. declare no competing financial interests.

Figures

Figure 1
Figure 1
Experimental and analytical design for the study of the intergenerational and developmental dynamics of TBT-dependent variation of DNA methylomes and transcriptomes. (A) Experimental design of a TBT-based transgenerational study previously described in. F0 females were exposed to the obesogen TBT via the drinking water. Six F3 and F4 tissues were harvested and processed for DNA methylome and transcriptome analyses. Mesenchymal stem cells (MSCs) were obtained from 8 weeks old F3 and F4 female and male femurs and tibias. Liver and gonadal white adipose tissue (gWAT) were harvested from 33 week old males that had been exposed to a diet challenge. (B) Analytical design for the study of the intergenerational and developmental dynamics of TBT-dependent variation of DNA methylomes and transcriptomes. TBT-dependent variation of DNA methylomes and transcriptomes for each tissue was inspected using MBD-seq and RNA-seq, respectively. Names used for each tissue make reference to their generation (F3, F4), sex (F: female, M: Males), and tissue (MSCs, gWAT, and liver). The integrative analysis of TBT-dependent variation of DNA methylomes and transcriptomes for MSCs in F3/F4 females and males would permit inspecting their dynamics through mitosis, meiosis, and epigenetic reprogramming events. The integrative analysis TBT-dependent variation of DNA methylomes and transcriptomes for F4 male MSCs, gWAT and liver would permit inspecting their dynamics through mitosis, and developmental transitions.
Figure 2
Figure 2
Intergenerational and developmental dynamics of TBT-dependent variation of DNA methylomes and transcriptomes. (A) Distribution of TBT-dependent variation for DNA methylomes with regard to regions of the mouse genome defined by their base composition in six somatic tissues. L1, L2, H1, H2 and H3 represent genomic regions with a tendency toward uniformity in base composition or isochores, from the most AT-enriched to the most GC-enriched,. Hypermethylated or hypomethylated DMRs represent cases for which MBD-seq read coverage was significantly higher or lower in TBT than in control samples, respectively. Hyper-/hypomethylated DMR ratios were calculated as indicated in the Methods section. To assess whether observed hyper-/hypomethylated DMR ratios were significantly different from those expected just by chance, we compared them with hyper-/hypomethylated DMR ratios calculated after randomly rearranging isochore type tags 10,000 times. (B,C) TBT-dependent biases for the expression of genes located within regions of the mouse genome defined by their base composition or by TBT-dependent variation in DNA methylomes in six somatic tissues. Gene expression bias indices using transcript abundance mean for TBT and control samples (mGEBI) were calculated as indicated in the Methods section. Positive or negative mGEBIs represent cases for which gene expression tends to be higher or lower in TBT than in control samples, respectively. To assess whether observed GEBIs were significantly different from those expected just by chance, we compared them with GEBIs calculated after randomly rearranging signed ranks for each tissue 10,000 times. For each measure and tissue, we draw areas delimited by observed/5th and 95th expected-by-chance percentile ratios. Observed measures were considered significantly higher or lower than measures expected by chance (p < 0.05) if the highlighted area is above or below the 0 value, respectively, and no significantly different from measures expected by chance (p ≥ 0.05) if the highlighted area spanned the 0 value. DMR: differentially methylated region; gWAT: gonadal white adipose tissue; isoDMBs: iso-directional differentially methylated blocks; MSCs: mesenchymal stem cells; TBT: tributyltin.
Figure 3
Figure 3
Mouse and human susceptibility to self-propagating disruptions of chromatin organization that predispose to metabolic disorders. (A,C) Distribution of functionally related genes with regard to AT- and GC-enriched regions of mouse (A) and human genomes (C). L1, L2, H1, H2 and H3 represent genomic regions with a tendency toward uniformity in base composition or isochores, from the most AT-enriched to the most GC-enriched,. Mouse and human genes associated with Gene Ontology (GO) terms “chromosome organization” (GO:0051276), “chromatin organization” (GO:0006325), “metabolic process” (GO:0008152), and “detection of stimulus” (GO:0051606) were retrieved from the Gene Ontology Consortium database. GO enrichments were calculated as indicated in the Methods section. To assess whether observed GO enrichments were significantly different from those expected by chance, we compared them with GO enrichments calculated after randomly rearranging isochore type tags 10,000 times. (B) TBT-dependent biases for the expression of functionally related genes in six somatic tissues. Gene expression bias indices using transcript abundance mean for TBT and control samples (mGEBI) were calculated as indicated in the Methods. Positive or negative mGEBIs represent cases for which gene expression tends to be higher or lower in TBT than in control samples, respectively. indicated in the Methods section. To assess whether observed GWAS SNP enrichments were significantly different from those expected by chance, we compared them with GWAS SNP enrichments calculated after randomly rearranging isochore type tags 10,000 times. For each measure, we draw areas delimited by observed/5th and 95th expected-by-chance percentile ratios. Observed measures were considered significantly higher or lower than measures expected by chance (p < 005) if the highlighted area is above or below the 0 value, respectively, and no significantly different from measures expected by chance (p ≥ 0.05) if the highlighted area spanned the 0 value. F: females; M: males; TBT: tributyltin; MSCs: mesenchymal stem cells; gWAT: gonadal white adipose tissue; NHGRI-EBI: National Human Genome Research Institute-European Bioinformatics Institute; GWAS: genome-wide association studies.
Figure 4
Figure 4
Model for intergenerational reconstructive propagation of environmental disruptions of chromatin organization. Based on our integrative analyses of TBT-dependent variation of DNA methylomes and transcriptomes of F3 and F4, females and males MSCs and F4 male gWAT and liver, and chromatin accessibility of F3 and F4 male sperm, we argue that the exposure to environmental stressors like TBT can cause a self-propagating disruption of chromatin organization, which is symbolized in this cartoon as changes in the spatial arrangement of an ideal chromosome in an ideal tissue (1 and 2). We argue that environmental disruptions of chromatin organization might be able of self-reconstructing through development and across generations and predispose to metabolic disorders because the disruption itself subsequently bias in a concerted way the expression of “chromatin organization” and “metabolic process” genes (3 and 4), which is symbolized in this cartoon as an increase in the number of proteins encoded by each type of genes. Our model does not include which is the nature of the original effect caused by the ancestral exposure to an environmental stressor, e.g., direct disruption of chromatin organization or alteration of chromatin organization determinants (2). MSCs: mesenchymal stem cells; gWAT: gonadal white adipose tissue.

Similar articles

Cited by

References

    1. Hales, C. M., Carroll, M. D., Fryar, C. D. & Ogden, C. L. Prevalence of Obesity Among Adults and Youth: United States, 2015–2016. NCHS Data Brief, 1–8. (2017). - PubMed
    1. Biener A, Cawley J, Meyerhoefer C. The High and Rising Costs of Obesity to the US Health Care System. J Gen Intern Med. 2017;32:6–8. doi: 10.1007/s11606-016-3968-8. - DOI - PMC - PubMed
    1. Janesick AS, Blumberg B. Obesogens: an emerging threat to public health. Am J Obstet Gynecol. 2016;214:559–565. doi: 10.1016/j.ajog.2016.01.182.. - DOI - PMC - PubMed
    1. Liu G, et al. Perfluoroalkyl substances and changes in body weight and resting metabolic rate in response to weight-loss diets: A prospective study. PLoS Med. 2018;15:e1002502. doi: 10.1371/journal.pmed.1002502.. - DOI - PMC - PubMed
    1. Heindel JJ, Blumberg B. Environmental Obesogens: Mechanisms and Controversies. Annu Rev Pharmacol Toxicol. 2019;59:89–106. doi: 10.1146/annurev-pharmtox-010818-021304.. - DOI - PMC - PubMed

Publication types