. 2019 Sep 10;9(1):13060.
doi: 10.1038/s41598-019-49416-2.

Dynamics of centriole amplification in centrosome-depleted brain multiciliated progenitors

Affiliations

Dynamics of centriole amplification in centrosome-depleted brain multiciliated progenitors

Olivier Mercey et al. Sci Rep. .

Abstract

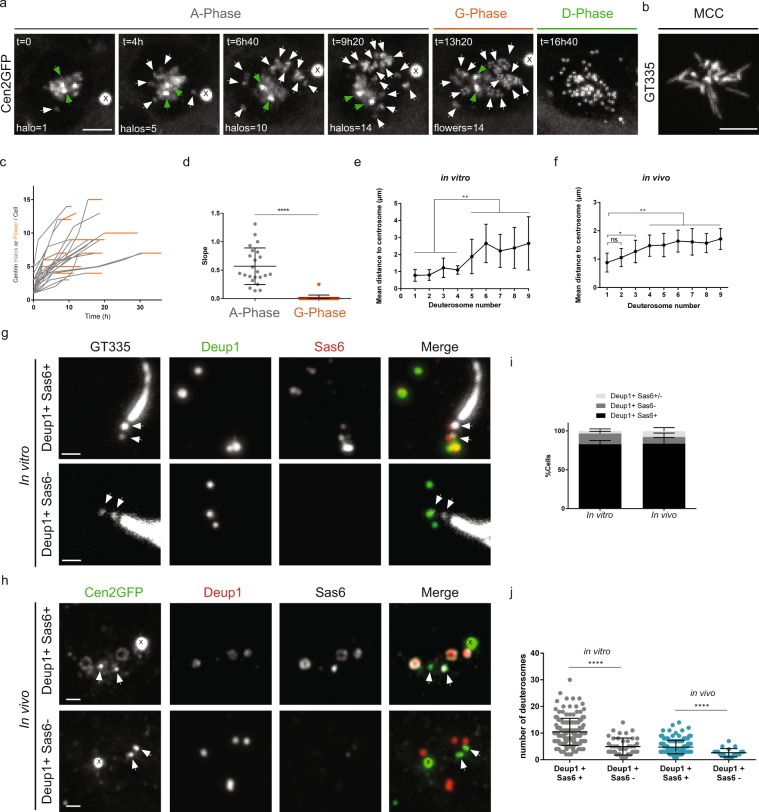
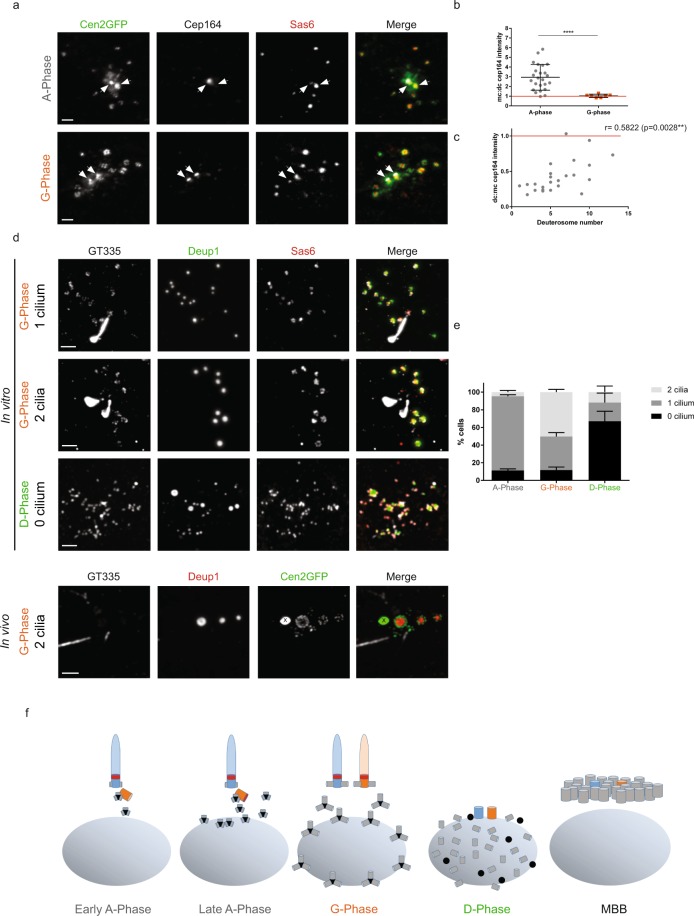
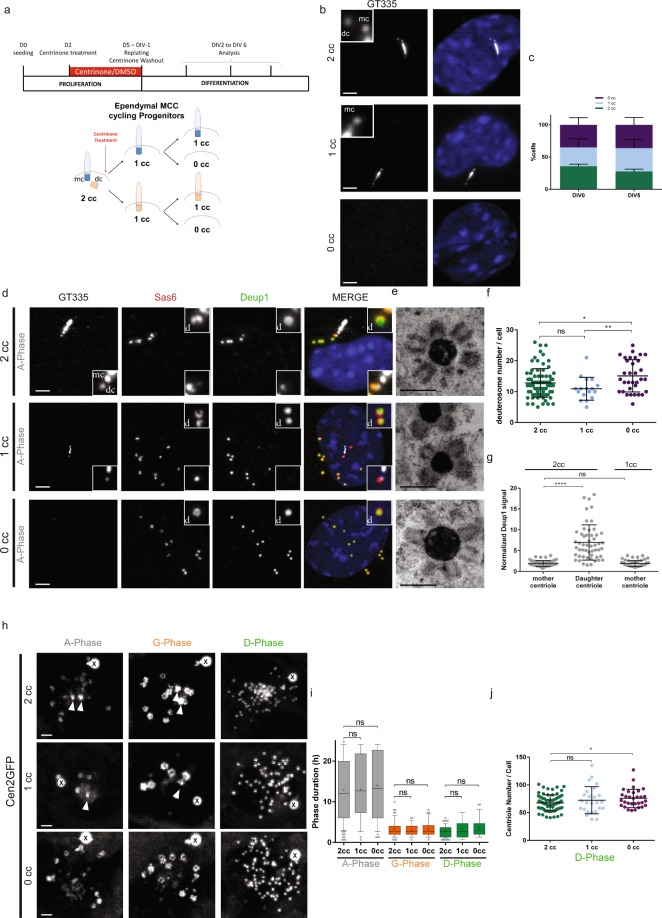
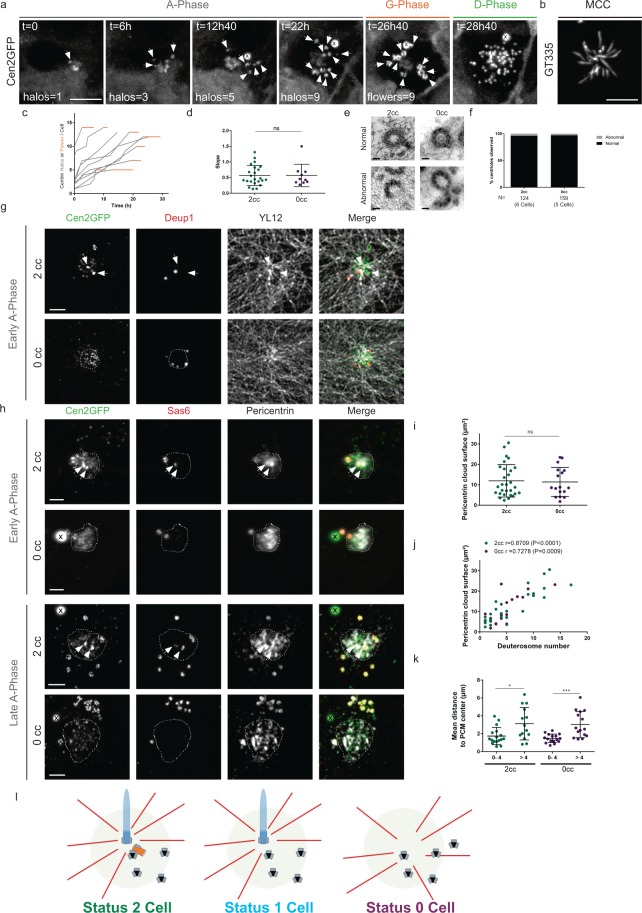
Reproductive and respiratory organs, along with brain ventricles, are lined by multiciliated epithelial cells (MCC) that generate cilia-powered fluid flows. MCC hijack the centrosome duplication pathway to form hundreds of centrioles and nucleate motile cilia. In these cells, the large majority of procentrioles are formed associated with partially characterized organelles called deuterosomes. We recently challenged the paradigm that deuterosomes and procentrioles are formed de novo by providing data, in brain MCC, suggesting that they are nucleated from the pre-existing centrosomal younger centriole. However, the origin of deuterosomes and procentrioles is still under debate. Here, we further question centrosome importance for deuterosome and centriole amplification. First, we provide additional data confirming that centriole amplification occurs sequentially from the centrosomal region, and that the first procentriole-loaded deuterosomes are associated with the daughter centriole or in the centrosomal centriole vicinity. Then, to further test the requirement of the centrosome in deuterosome and centriole formation, we depleted centrosomal centrioles using a Plk4 inhibitor. We reveal unexpected limited consequences in deuterosome/centriole number in absence of centrosomal centrioles. Notably, in absence of the daughter centriole only, deuterosomes are not seen associated with the mother centriole. In absence of both centrosomal centrioles, procentrioles are still amplified sequentially and with no apparent structural defects. They seem to arise from a focal region, characterized by microtubule convergence and pericentriolar material (PCM) assembly. The relevance of deuterosome association with the daughter centriole as well as the role of the PCM in the focal and sequential genesis of centrioles in absence of centrosomal centrioles are discussed.


Conflict of interest statement

The authors declare no competing interests.

Figures

Figure 1
Figure 1
Centriole amplification proceeds sequentially and arises from the centrosomal region. (a) Time lapse sequences of a Cen2GFP ependymal progenitor undergoing the different stages (A-Phase, G-Phase and D-Phase) of centriole amplification. Early A-Phase is characterized by Cen2GFP cloud surrounding centrosomal centrioles and the first visible halos in the nearby cytoplasm. As amplification progresses, the number of halos increases and they localize throughout the cytoplasm. In G-Phase, the final number of halos is reached, Cen2GFP halos transform into flowers where procentrioles are becoming visible. In D-Phase, procentrioles individualize. White arrows indicate centrin halos or flowers. Green arrows indicate centrosomal centrioles. (b) Cilia immunostaining with GT335 antibody of a Cen2GFP ependymal MCC at the end of a time lapse experiment. (c) Number of centrin halos (Gray) or flowers (Orange) during time lapse experiments in Cen2GFP ependymal progenitors (Δt = 40 min, n = 23 cells). Halos or flowers are sometimes masked because of their backward movements toward the centrosomal region. Consequently, they have been counted during expansion phases when each single structure is clearly visible by 3D monitoring. (d) Trend line slopes corresponding to each cell observed in c in A-Phase and G-phase. (e,f) Mean distances of deuterosomes to the centrosome depending on the number of deuterosomes in the cell in vitro (e, n = 67 cells), and in vivo (f, n = 134 cells). Deuterosomes were counted when positive for Deup1 and Sas6 stainings. (g,h) Immunostaining of cells in A-phase with loaded (Deup1+/Sas6+) or unloaded (Deup1+/Sas6−) deuterosomes, in vitro (g), and in vivo (h). Arrows indicate centrosomal centrioles. (i) Quantification of cells with loaded (Deup1+/Sas6+), partially loaded (Deup1+/Sas6+/−) or unloaded deuterosomes (Deup1+/Sas6−) in vitro (n = 128 cells) and in vivo (n = 279 cells). (j) Quantification of the number of deuterosomes depending on the loading status of deuterosomes in vitro and in vivo (n = 196 cells in vitro, n = 165 cells in vivo). « X » indicates GFP aggregates. Scale bars: (a,b) 5 µm; (g,h) 1 µm.
Figure 2
Figure 2
Daughter-to-mother centriole conversion at the A- to G-phase transition. (a) Cep164 and Sas6 immunostainings on Cen2GFP ependymal progenitors during A- and G-Phases. Arrows indicate centrosomal centrioles. (b) Mother:daughter centriole (mc:dc) Cep164 signal ratios in A-phase (n = 24 cells) and G-Phase (n = 7 cells). (c) Correlation between mc:dc Cep164 signal ratios and deuterosome numbers in the cells during A-Phase (n = 24 cells from b). (d) GT335, Deup1 and Sas6 immunostainings on ependymal progenitors during G- and D-Phases in vitro and G-phase in vivo. (e) Percentage of cells with 0, 1 or 2 GT335 positive cilia in A-, G- and D-phases in vitro (n = 210, 73 and 21 cells in A-, G- and D-phase, respectively). (f) Representative scheme of centrosomal centriole behaviour during centriole amplification. Nucleus is represented in gray, deuterosomes in black, procentrioles in gray, Cep164 in red, mother centriole in blue, daughter centriole in orange. « X » indicates Cen2GFP aggregate. Scale bars: 2 µm.
Figure 3
Figure 3
Depletion of centrosomal centrioles only slightly affects centriole amplification in brain MCC. (a) Experimental procedure used to deplete centrosomal centrioles in MCC cycling progenitors using centrinone. See methods. 2cc, 1cc or 0cc for 2, 1 or 0 centrosomal centriole(s), respectively. (b) Representative pictures of 2cc, 1cc or 0cc ependymal progenitor cells stained with GT335. (c) Repartition of 2cc, 1cc or 0cc cell populations at two different days of differentiation (DIV for Day In Vitro). Cells selected for this quantification are ependymal progenitors that have not started centriole amplification (« centrosome » stage; n = 912 and 566 cells at DIV0 and DIV5 respectively). (d) Representative GT335, Deup1 and Sas6 immunostainings of 2cc, 1cc or 0cc cells during A-Phase. Zoom in pictures highlight deuterosomes « d » and centrosomal centrioles (mc: mother centriole and dc: daughter centriole). (e) Representative EM pictures of deuterosomes in 2cc, 1cc or 0cc cells. The status of the centrosome was identified by correlative light and electron microscopy. (f) Quantification of deuterosome number per cell in 2cc, 1cc or 0cc cells during G-Phase. 2cc cells have been taken from DMSO and centrinone-treated cultures (n = 80, 17, 33 cells for 2cc, 1cc and 0cc, respectively). (g) Normalized Deup1 signal (centrosomal centriole:cytoplasmic Deup1 signal) on mother and daughter centriole in 2cc cells, or on mother centriole in 1cc cells during A-Phase (n = 52 and 54 cells for 2cc and 1cc respectively). (h) Sequences from time lapse experiments on 2cc, 1cc or 0cc Cen2GFP cells. Note that a Cen2GFP cloud is still present in 0cc cells. (i) Box (25 to 75%) and whisker (10 to 90%) plots of A- (Gray), G- (Orange), and D- (Green) phase duration in 2cc, 1cc or 0cc Cen2GFP progenitors. Lines indicate medians, and crosses indicate means. 2cc cells have been taken from DMSO and centrinone-treated cultures (in A-Phase: n = 107 cells for 2cc; n = 36 cells for 1cc; n = 49 cells for 0cc; in G-Phase: n = 73 cells for 2cc; n = 32 cells for 1cc; n = 36 cells for 0cc; in D-Phase: n = 65 cells for 2cc; n = 25 cells for 1cc; n = 28 cells for 0cc). (j) Final centriole number counted during D-Phase in 2cc, 1cc or 0cc Cen2GFP progenitors. Because centrosomal centrioles are no longer distinguishable from maturing procentrioles in D-Phase, quantification is performed after Cen2GFP videomicroscopy to know the orignal centrosome status of the cells. 2cc cells have been taken from DMSO and centrinone-treated cultures (n = 69 cells for 2cc; n = 25 cells for 1cc; n = 31 cells for 0cc). Arrows indicate centrosomal centrioles. « X » indicates GFP aggregates. Scale bars: 2 µm for optical microscopy, 500 nm for EM.
Figure 4
Figure 4
Centrosomal centriole-depleted cells form procentrioles within an acentriolar PCM cloud. (a) Live imaging of a Cen2GFP ependymal progenitor depleted from centrosomal centrioles undergoing the different stages (A-, G- and D-Phase) of centriole amplification. (b) GT335 immunostaining of a 0cc Cen2GFP ependymal MCC at the end of the time lapse experiment. (c) Number of centrin halos (Gray) or flowers (Orange) during time lapse experiments in 0cc Cen2GFP ependymal progenitors (Δt = 40 min, n = 10 cells). Timepoints are chosen when halos or flowers number is clearly visible. (d) Comparison of centrin halo formation rate between 2cc or 0cc cells during A-Phase. Each dot represents the trendline slope corresponding to a cell observed during A-Phase in Fig. 1c (2cc cells) and (c) (0cc cells). (e) Representative pictures of normal and abnormal centrioles ultrastructure in 2cc or 0cc cells observed at the multiple basal body stage. See methods. (f) Quantification of the integrity of centrioles ultrastructure in 2cc (6 cells observed in differentiated control cultures) and 0cc cells (5 cells observed with CLEM after videomicroscopy; See Methods). (g) Immunostainings showing deuterosome localization (Deup1) and the tyrosinated tubulin network (YL12) in 2cc or 0cc cells during early A-Phase. In 2cc cells, microtubule network converges on one centrosomal centriole whereas in 0cc cells, it converges on Cen2GFP cloud. Dashed line delineates Cen2GFP cloud. (h) Representative pictures of Pericentrin and Sas6 immunostainings during early or late A-Phase in 2cc or 0cc cells. Dashed line delineates the Pericentrin cloud. (i) Surface of the Pericentrin cloud in 2cc and 0cc cells during A-phase (n = 29 cells for 2cc, n = 17 cells for 0cc). (j) Correlation between the Pericentrin cloud surface and the number of deuterosomes in the cell in 2cc (green) or 0cc (purple) cells (n = 29 cells for 2cc, n = 17 cells for 0cc). (k) Mean distance of deuterosomes to PCM center depending on the number of deuterosomes in the cells for 2cc and 0cc cells (for 2cc: 0–4 deuterosomes: n = 17 cells; >4 deuterosomes: n = 14 cells. for 0cc: 0–4 deuterosomes: n = 16 cells; >4 deuterosomes: n = 15). (l) Model for centriole amplification in 2cc, 1cc or 0cc cells. PCM cloud is represented in light green, deuterosomes in black, procentrioles in gray, microtubules in red. Arrows indicate centrosomal centrioles. « X » indicates GFP aggregates. Scale bars: (a,b) 5 µm: (e) 100 nm, (g,h) 2 µm.

Similar articles

Cited by

References

    1. Spassky N, Meunier A. The development and functions of multiciliated epithelia. Nat. Rev. Mol. Cell Biol. 2017;18:423–436. doi: 10.1038/nrm.2017.21. - DOI - PubMed
    1. Klos Dehring DA, et al. Deuterosome-Mediated Centriole Biogenesis. Dev. Cell. 2013;27:103–12. doi: 10.1016/j.devcel.2013.08.021. - DOI - PMC - PubMed
    1. Zhao H, et al. The Cep63 paralogue Deup1 enables massive de novo centriole biogenesis for vertebrate multiciliogenesis. Nat. Cell Biol. 2013;15:1434–44. doi: 10.1038/ncb2880. - DOI - PubMed
    1. Vladar, E. K. et al. Cyclin-dependent kinase control of motile ciliogenesis. Elife7 (2018). - PMC - PubMed
    1. Al Jord A, et al. Calibrated mitotic oscillator drives motile ciliogenesis. Science. 2017;358:803–806. doi: 10.1126/science.aan8311. - DOI - PubMed

Publication types