. 2019 Sep 10;9(1):12956.
doi: 10.1038/s41598-019-49427-z.

Alginates along the filament of the brown alga Ectocarpus help cells cope with stress

Affiliations

Alginates along the filament of the brown alga Ectocarpus help cells cope with stress

Hervé Rabillé et al. Sci Rep. .

Abstract

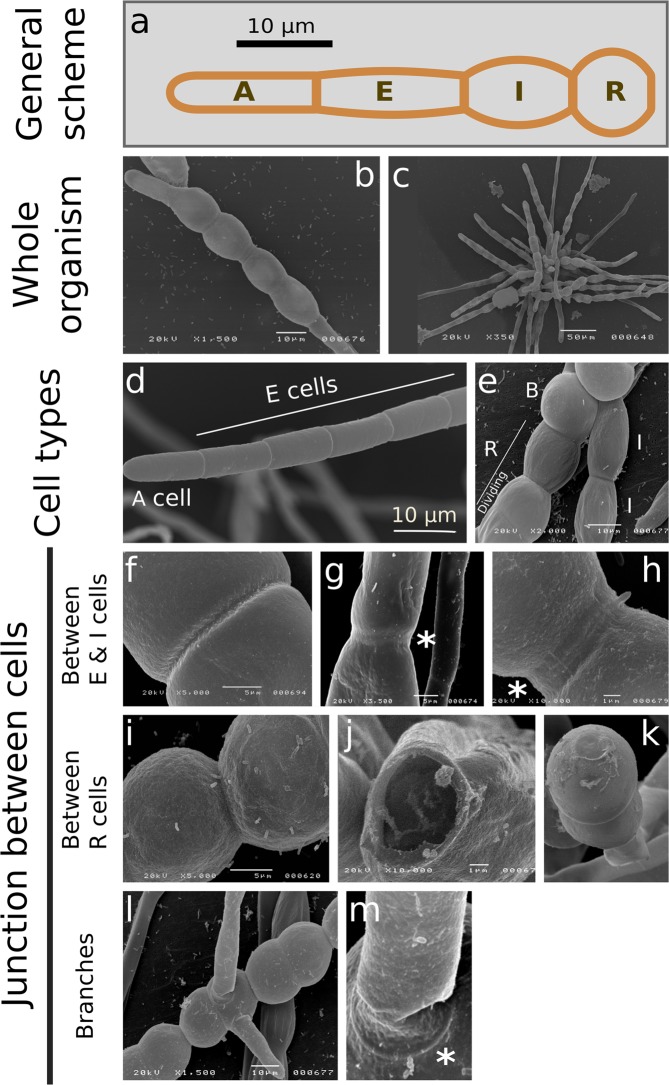
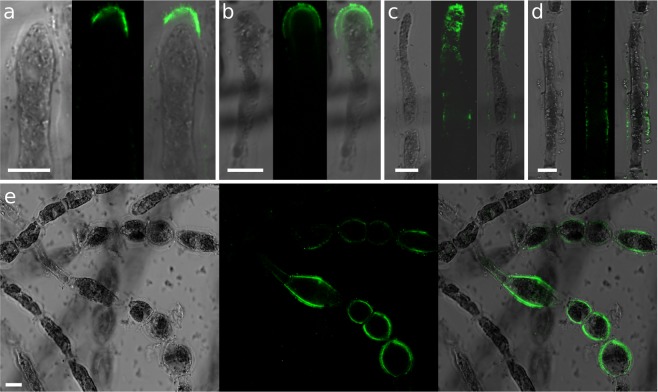
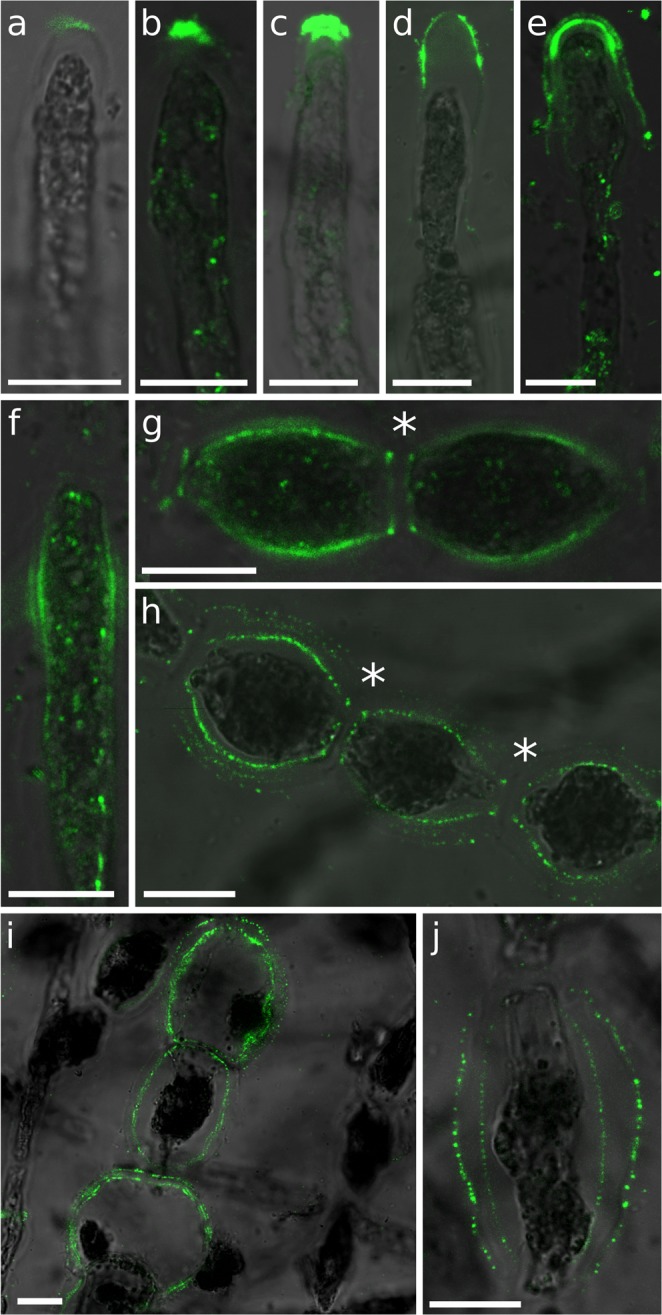
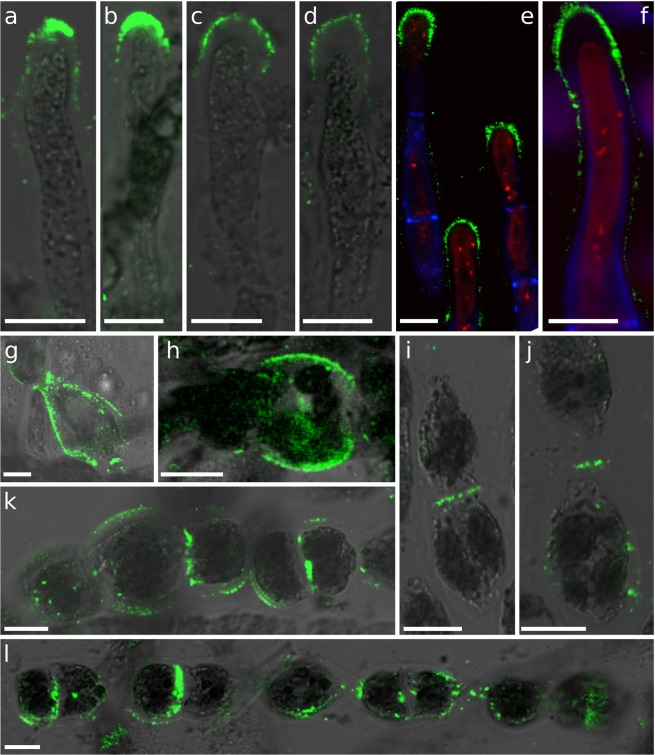
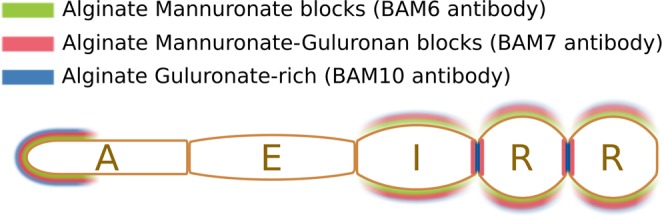
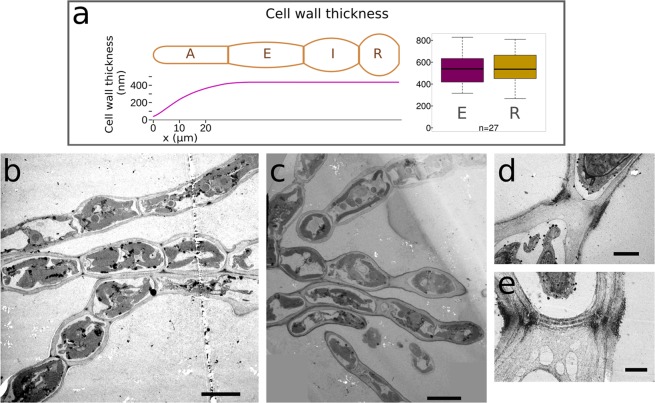
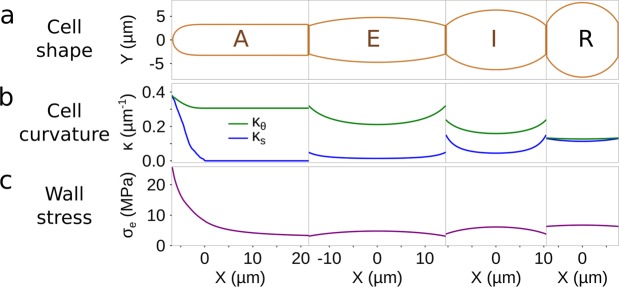
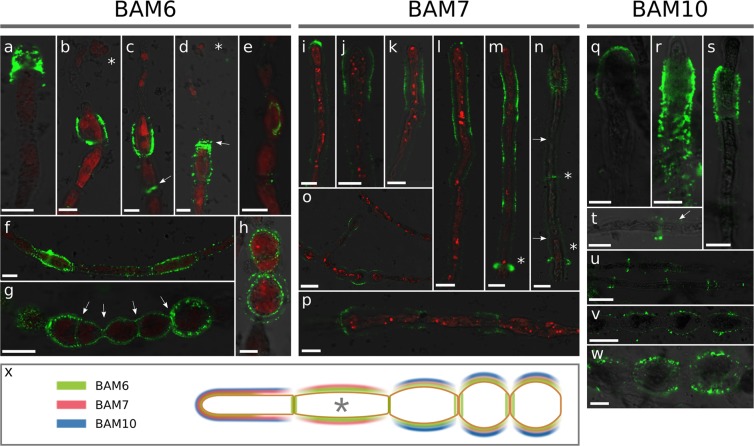
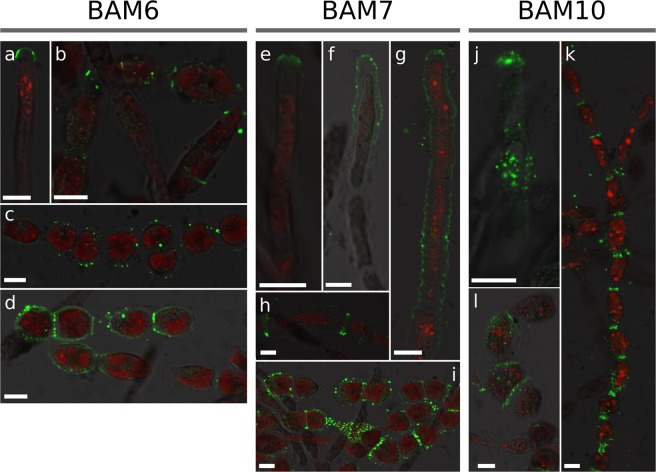
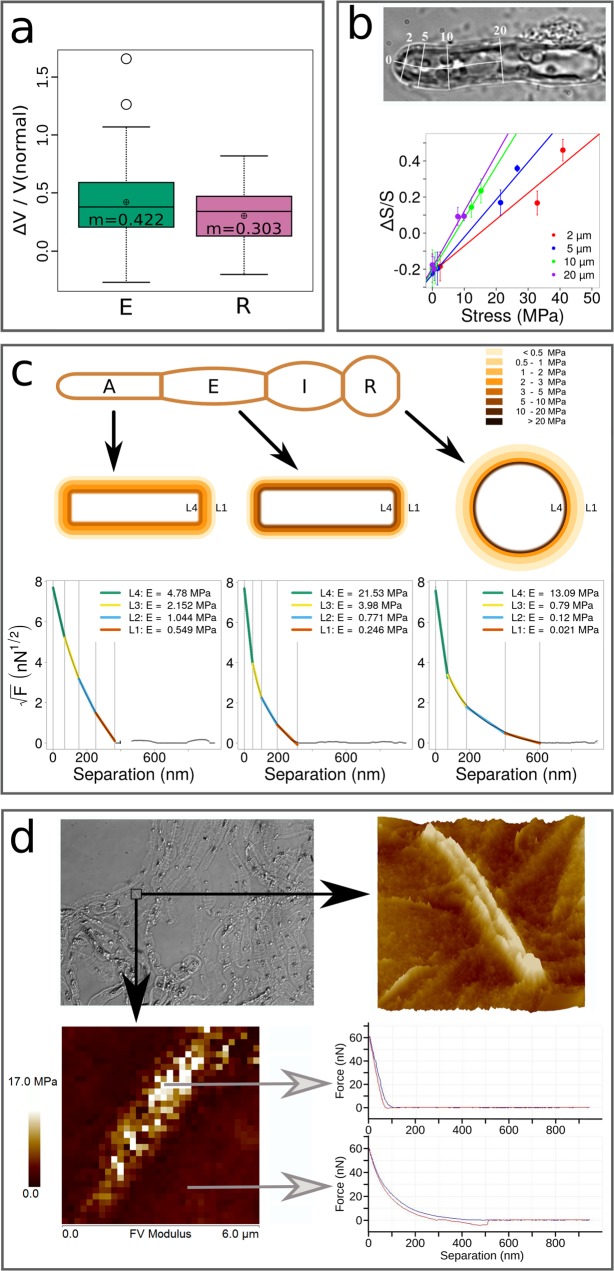
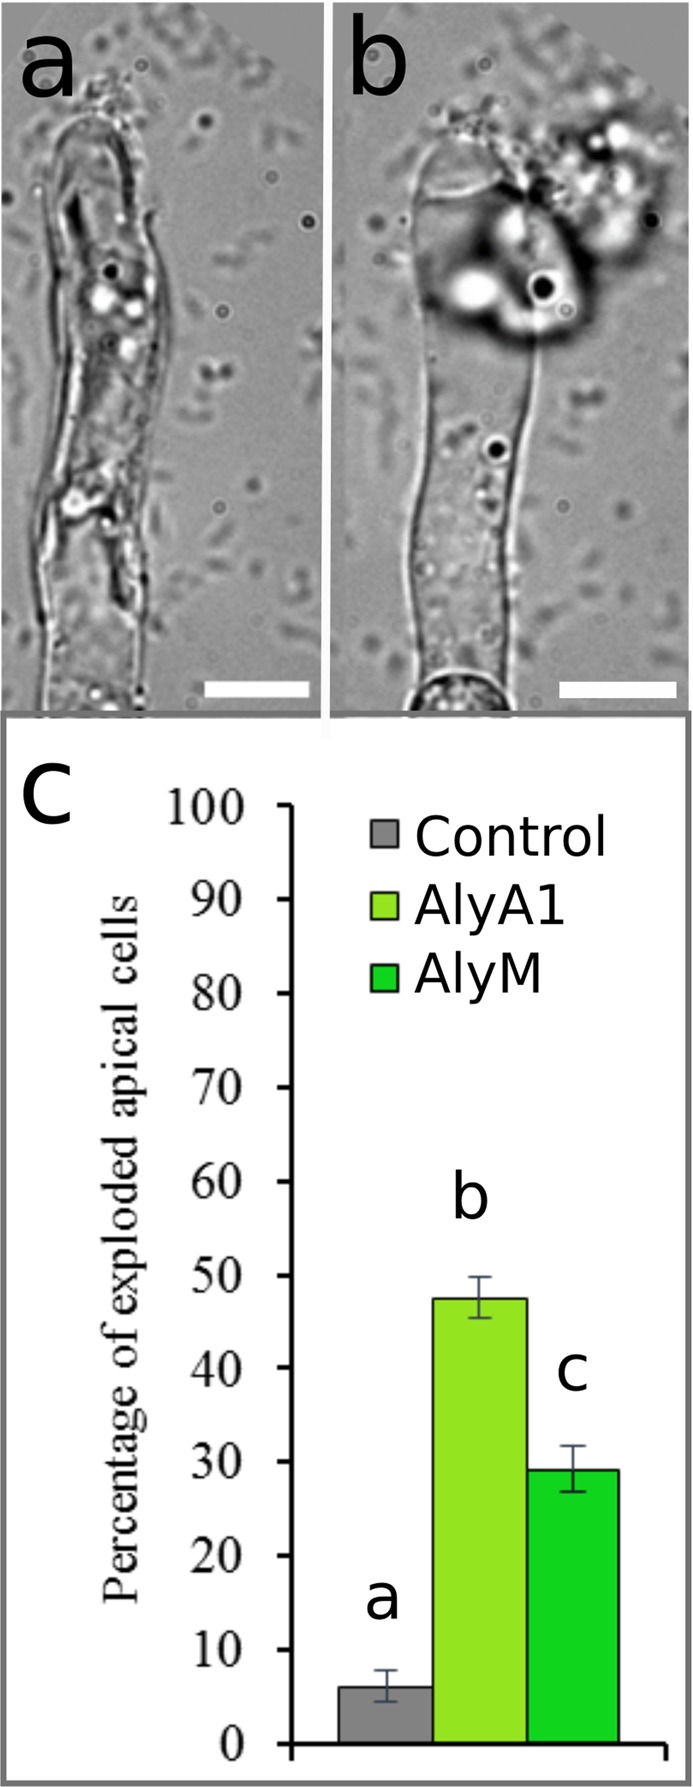
Ectocarpus is a filamentous brown alga, which cell wall is composed mainly of alginates and fucans (80%), two non-crystalline polysaccharide classes. Alginates are linear chains of epimers of 1,4-linked uronic acids, β-D-mannuronic acid (M) and α-L-guluronic acid (G). Previous physico-chemical studies showed that G-rich alginate gels are stiffer than M-rich alginate gels when prepared in vitro with calcium. In order to assess the possible role of alginates in Ectocarpus, we first immunolocalised M-rich or G-rich alginates using specific monoclonal antibodies along the filament. As a second step, we calculated the tensile stress experienced by the cell wall along the filament, and varied it with hypertonic or hypotonic solutions. As a third step, we measured the stiffness of the cell along the filament, using cell deformation measurements and atomic force microscopy. Overlapping of the three sets of data allowed to show that alginates co-localise with the stiffest and most stressed areas of the filament, namely the dome of the apical cell and the shanks of the central round cells. In addition, no major distinction between M-rich and G-rich alginate spatial patterns could be observed. Altogether, these results support that both M-rich and G-rich alginates play similar roles in stiffening the cell wall where the tensile stress is high and exposes cells to bursting, and that these roles are independent from cell growth and differentiation.


Conflict of interest statement

The authors declare no competing interests.

Figures

Figure 1
Figure 1
Filament organisation and cell morphologies observed by scanning electronic microscopy. (a) Overview of Ectocarpus sporophyte filament (prostrate) growing from spore germination. Five cell types are defined according to their position and shape. A type: Apical cell; E type: Elongated, cylindrical cell; I type: Intermediate cell; R type: Round, spherical cells positioned at the central region of the filaments; B type: Branched cells. Cell types are defined according to their position (for A cells) and their ratio of their length (L) to their width (w) (E, I and R cells). E cell: L/w > 2; I cell: L/w in [1.2; 2[; R cell: L/w < 1.2. The number of E, I, R and B increases with the filament maturation stage. Cells of the same cell types are contiguous. (b,c) Whole organism observed by scanning electronic microscopy (SEM); One week post germination (b), or 2–3 weeks post germination (c).(d) A and E cells at the filament extremity. (e) I and R cell types in the central region of the filament. B indicates branching cells. (fh) Junctions between E cells (f) and I cells (g,h), showing either single- (f) or double- ring(s) framing the wall (asterisks in g, h). (ik) Junctions between R cells. (lm) Higher magnification on branches, showing a ring at the junction site (asterisk).
Figure 2
Figure 2
Mannuronate-rich alginate regions labelled with BAM6 antibody. BAM6 labelling of: (ac) A cells; (d) E cells; (e) I and R cell types. Bright field, confocal and merge channels are shown for each cell. Acquisition time and laser intensity were constant. Scale bar 10 µm.
Figure 3
Figure 3
Mannuronate-Guluronate alginate regions labelled with BAM7 antibody. BAM7 labelling of: (ae) A cells; (f) E-cell; (gj) I and R cells. Merge of bright field and fluorescent signals are shown. Fluorescent signal was acquired with different acquisition times depending on the micrograph. Asterisk indicates the double rings. Scale bar 10 µm.
Figure 4
Figure 4
Guluronan-rich alginate regions labelled with BAM10 antibody. BAM10 labelling of: (af) A cells; (hj) I cells; (gl) R cells. Merge of bright field and fluorescent signals are shown, except in E & F where FITC, calcofluor (UV light, blue) and autofluorescence of chloroplasts (red) were merged. Fluorescent signal was acquired with different acquisition times depending on the photo. Scale bar 10 µm.
Figure 5
Figure 5
Summary of alginate mapping along the filament of Ectocarpus. Schematic of a sporophyte filament is shown with the four main cell types A, E, I and R. In living filaments, several cells of each type are grouped together. For simplicity, only one cell of each cell type is shown here. Colours indicate immunolocalisation of monoclonal antibodies BAM6, BAM7 and BAM10. Colour lines do not represent different cell wall layers, but the different antibodies.
Figure 6
Figure 6
Cell wall thickness and structure along the filament. (a) (Right) Quantification of cell wall thickness in E and R cell types from TEM micrographs (n = 27, Student t-test, P value = 0.867), and (Left) Schematic representation summarising the cell wall thickness (y-axis, in nm) in different cell types along the filament (x-axis, in µm). (b,c) Representative TEM longitudinal sections showing uniform cell wall organisation and thickness along the filaments. (d,e) Higher magnification of transverse junctions showing the presence of dark rings. Scales 10 µm (b,c), 2 µm (d) or 1 µm (e).
Figure 7
Figure 7
Curvature and wall stress along the filament. Curvatures Κ (y-axis, in µm−1) were calculated for each cell shape (Y) along the filament (X, in µm) in two perpendicular directions: the meridional (blue) and the circumferential (green) directions. Wall stress σe (y-axis, in MPa) was calculated by taking into account the turgor measured by limit plasmolysis (Suppl Table S1) and the cell wall thickness measured by TEM (Fig. 6). For A cells, values were obtained from.
Figure 8
Figure 8
Alginate location in response to a hypotonic shock. Filaments were cultured in sea water (550 mOsmol.L−1), corresponding to half strength normal sea water, to increase cell turgor pressure. (ah) BAM6 labelling: (ad) Apex of filaments, showing either intact (a) or burst (bd) A cells (asterisk: extruded chloroplast in burst A cells); (e) labelling of I cell side, also seen in E and R cells (not shown). (f) Portion of filament, showing that wider, I cells are more labelled than E cells. (g) R cells uniformly labelled, including transverse junctions (arrow). (h) Higher magnification of different labelled cell wall layers in R cells. (i–p) BAM7 labelling: (ik) Apical cells; (ln) Apical and sub-apical cells & discrete rings in E cells (asterisks); (op) Rare and weak labelling of R cells. (q–w): BAM10 labelling; (qs) Apical cells; (tu) E and I cells; (vw) R cells. White arrows show transverse junction/wall. Micrographs are merged confocal stacks taken with three channels: green; FITC; red: chloroplast autofluorescence; grey: several lasers to simulate bright-field photos. Scale bar is 10 µm, except for o, u, v where it is 25 µm. (x) Summary of alginate mapping along the filament of Ectocarpus exposed to a hypotonic shock. Asterisk is for cases when the apical cell burst.
Figure 9
Figure 9
Alginate location in response to a hypertonic shock. Filaments were cultured in double strength sea water (2000 mOsmol L−1) to suppress the cell turgor pressure. (ad) Immunolocalisation with BAM6: (a) Apical cell, (b) I cells, (c,d) R cells. (ei) Immunolocalisation with BAM7: (eg) Apical and sub-apical cells, (h) I cell bordered by transverse junctions with adjacent cells, (i) Group of R cells. (jl) Immunolocalisation with BAM10: (j) Apical cell, (k) Portion of filament made of E and I cells, (l) R cells in the centre of a filament with a recently divided cell in the middle. Same confocal detection channels as in Fig. 8. Scale bar 10 µm.
Figure 10
Figure 10
Stiffness along the filament. (a) Stiffness between E and R cells measured by dilatation/retraction experiments. Cell expansion was observed in response to immersion into fresh water. Plot represents the ratio of volume of E and R cells before and after immersion. Volumes were calculated from the cell dimensions, namely their length and width assuming that they are symmetrical. Measurements were carried out by ImageJ on bright field photos. n = 99 for E cells and n = 55 for R cells. T-test P value = 0.0106. (b) Stiffness in the dome measured by dilatation/retractation. The circumferential deformation of Ectocarpus apical cells was plotted as a function of the distance from the tip. Cells were subjected to inflation or retraction by transfer into hypo- or hypertonic sea waters respectively (see text for details). (Top) Relative circumferential deformation was measured at 2, 5, 10 and 20 µm from the tip. (Bottom) The deformation (calculated on a cell wall ring; ΔS/S) was plotted as a function of the local cell wall stress (σe) calculated at each position after the deformation was stabilised. Normal condition (sea water ~1000 mOsmol L−1) is set to 0 (no deformation) for the four curves.  n = 63 cells for each curve. (c) Stiffness along the filament measured by nano-indentation using Atomic Force Microscopy. (Top) Scheme representing a filament stereotype indicating the position of the four cell types. (Middle) Schemes representing the section of A, E and R cell types with four virtual layers whose thicknesses were inferred from the slope of the force curve. Colour stands for the average Elastic Modulus calculated from the force curves (n = 6 for A cells, n = 7 for E cells, and n = 4 for R cells; Table 1), based on the Sneddon model (see Methods for details about calculation). (Bottom) Example of one force curve for each cell type. X-axis: distance of separation (nm); Y-axis: square root of force (nN1/2). (d) Stiffness at transverse junctions by AFM. Three junctions were imaged independently for three distinct filaments and gave similar results. Only one is shown here. (Top left) DIC image of extracted cell walls from filaments (see text for details). The transverse junction is framed. (Top right) Topography image of the transverse junction between two R cells, showing the relief of the central structure. (Bottom left) Corresponding elasticity map of 6 × 6 µm area (36 µm2) extracted from an array of 32 × 32 (1024) force curves. Force curves measured at the junction (top) and at the surrounding surface (bottom). Indentation: blue curve; retractation: red curve. Several acquisitions were carried out for each junction and gave similar data.
Figure 11
Figure 11
Alginates prevent tip bursting. (a) Apical cell before a hypotonic shock; (b) Apical cell after the hypotonic shock, showing where cell bursts. (c) Percentage of burst apical cells after 10 min of incubation with 3U mL−1 of AlyM (right column) or 3.2U mL−1 of AlyA1 (G-specific, middle column) in full-strength Artificial Sea Water (ASW, control: grey column). Error bar represents 95% confidence interval. n = 15 independent experiments representing more than 800 A cells. Bars with different letters are for significant differences. χ² test with p < 0.001. Scale bar 5 µm.

References

    1. Baldauf SL. An overview of the phylogeny and diversity of eukaryotes. J. Syst. Evol. 2008;46:263–273.
    1. Silberfeld T, et al. A multi-locus time-calibrated phylogeny of the brown algae (Heterokonta, Ochrophyta, Phaeophyceae): Investigating the evolutionary nature of the “brown algal crown radiation”. Mol. Phylogenet. Evol. 2010;56:659–674. doi: 10.1016/j.ympev.2010.04.020. - DOI - PubMed
    1. Clarke JT, Warnock RCM, Donoghue PCJ. Establishing a time-scale for plant evolution. New Phytol. 2011;192:266–301. doi: 10.1111/j.1469-8137.2011.03794.x. - DOI - PubMed
    1. Raven JA, Edwards D. Roots: evolutionary origins and biogeochemical significance. J. Exp. Bot. 2001;52:381–401. doi: 10.1093/jxb/52.suppl_1.381. - DOI - PubMed
    1. Charrier B, Le Bail A, de Reviers B. Plant Proteus: brown algal morphological plasticity and underlying developmental mechanisms. Trends Plant Sci. 2012;17:468–477. doi: 10.1016/j.tplants.2012.03.003. - DOI - PubMed

Publication types