

Genome wide transcriptome analysis reveals vital role of heat responsive genes in regulatory mechanisms of lentil (Lens culinaris Medikus)
- PMID: 31506558
- PMCID: PMC6736890
- DOI: 10.1038/s41598-019-49496-0
Genome wide transcriptome analysis reveals vital role of heat responsive genes in regulatory mechanisms of lentil (Lens culinaris Medikus)
Abstract
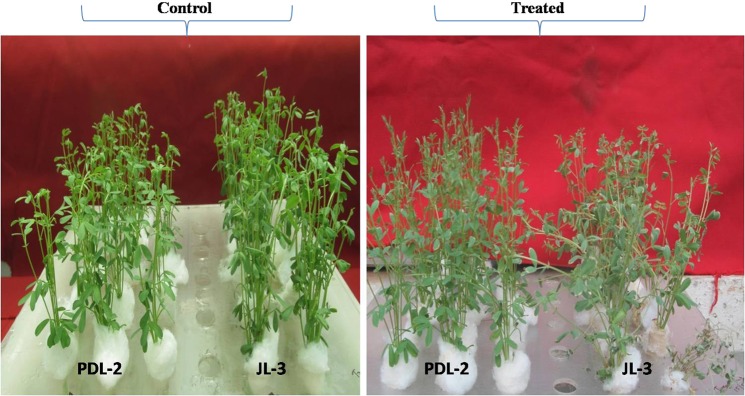
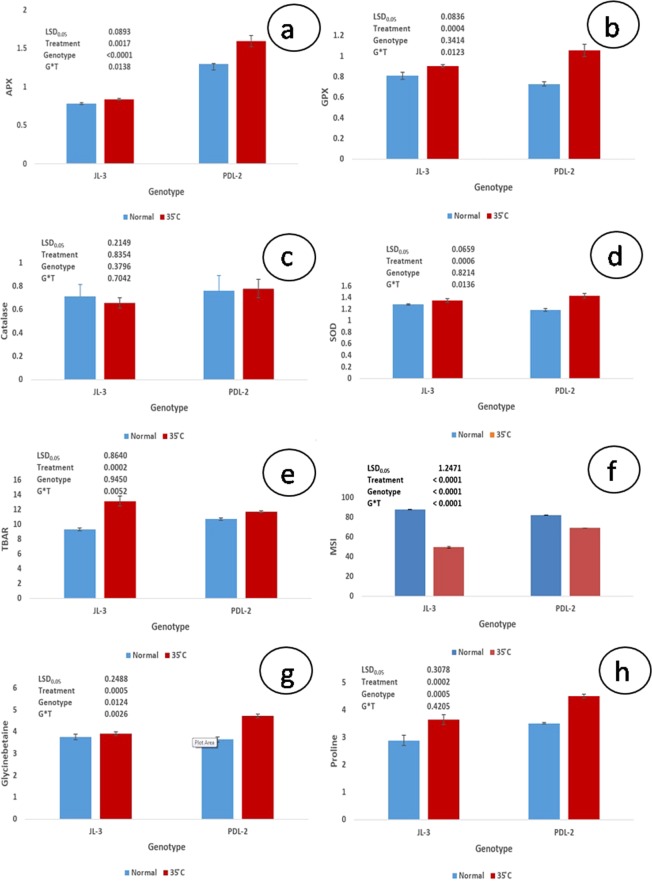
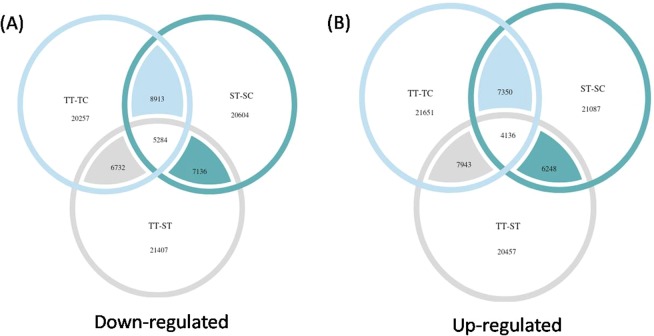
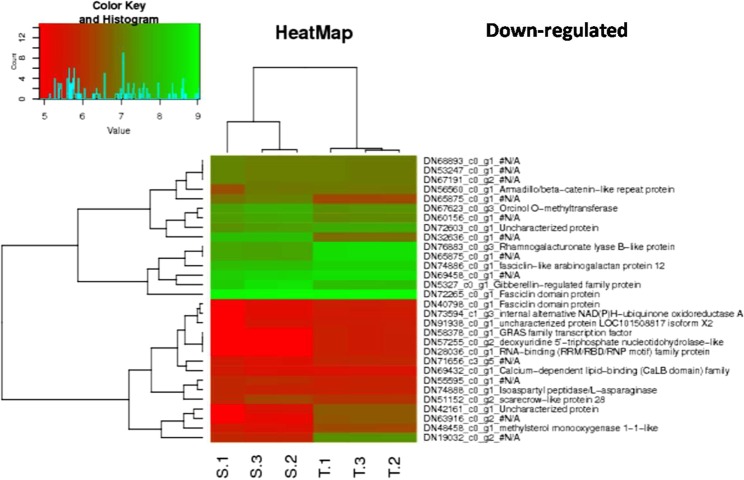
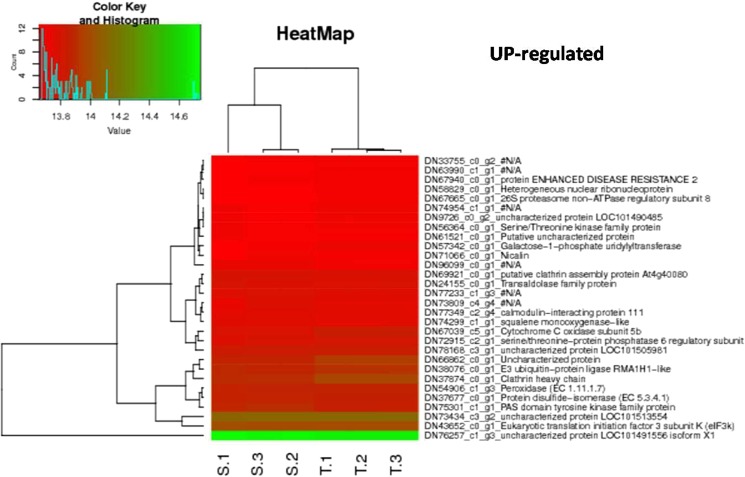
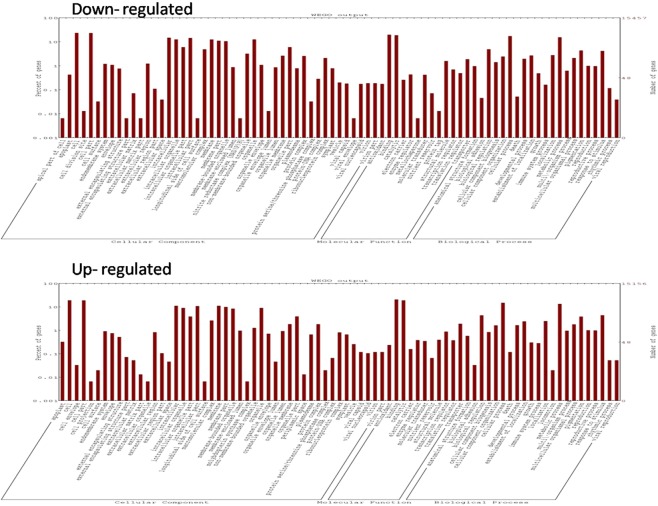
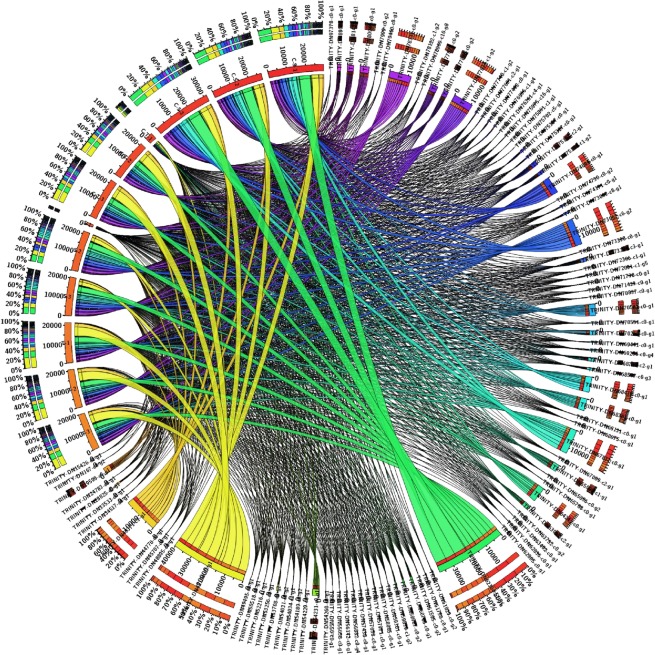
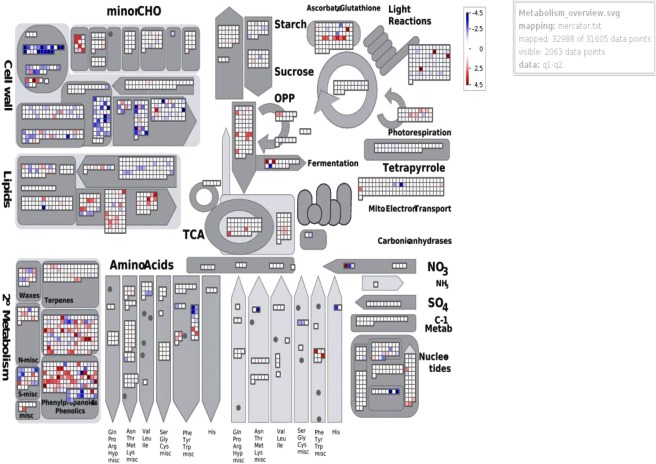
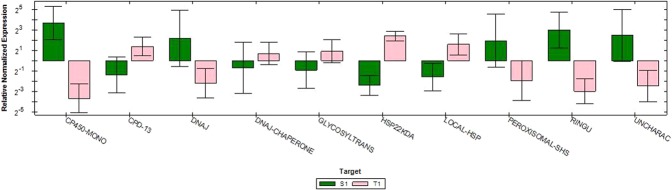
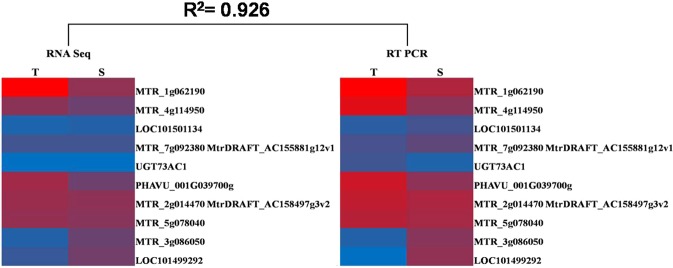
The present study reports the role of morphological, physiological and reproductive attributes viz. membrane stability index (MSI), osmolytes accumulations, antioxidants activities and pollen germination for heat stress tolerance in contrasting genotypes. Heat stress increased proline and glycine betaine (GPX) contents, induced superoxide dismutase (SOD), ascorbate peroxidase (APX) and glutathione peroxidase (GPX) activities and resulted in higher MSI in PDL-2 (tolerant) compared to JL-3 (sensitive). In vitro pollen germination of tolerant genotype was higher than sensitive one under heat stress. In vivo stressed pollens of tolerant genotype germinated well on stressed stigma of sensitive genotype, while stressed pollens of sensitive genotype did not germinate on stressed stigma of tolerant genotype. De novo transcriptome analysis of both the genotypes showed that number of contigs ranged from 90,267 to 104,424 for all the samples with N50 ranging from 1,755 to 1,844 bp under heat stress and control conditions. Based on assembled unigenes, 194,178 high-quality Single Nucleotide Polymorphisms (SNPs), 141,050 microsatellites and 7,388 Insertion-deletions (Indels) were detected. Expression of 10 genes was evaluated using quantitative Real Time Polymerase Chain Reaction (RT-qPCR). Comparison of differentially expressed genes (DEGs) under different combinations of heat stress has led to the identification of candidate DEGs and pathways. Changes in expression of physiological and pollen phenotyping related genes were also reaffirmed through transcriptome data. Cell wall and secondary metabolite pathways are found to be majorly affected under heat stress. The findings need further analysis to determine genetic mechanism involved in heat tolerance of lentil.
Conflict of interest statement
The authors declare no competing interests.
Figures
Similar articles
-
Transcriptome analysis of lentil (Lens culinaris Medikus) in response to seedling drought stress.BMC Genomics. 2017 Feb 27;18(1):206. doi: 10.1186/s12864-017-3596-7. BMC Genomics. 2017. PMID: 28241862 Free PMC article.
-
Linking genome wide RNA sequencing with physio-biochemical and cytological responses to catalogue key genes and metabolic pathways for alkalinity stress tolerance in lentil (Lens culinaris Medikus).BMC Plant Biol. 2022 Mar 5;22(1):99. doi: 10.1186/s12870-022-03489-w. BMC Plant Biol. 2022. PMID: 35247970 Free PMC article.
-
Transcriptome skimming of lentil (Lens culinaris Medikus) cultivars with contrast reaction to salt stress.Funct Integr Genomics. 2021 Jan;21(1):139-156. doi: 10.1007/s10142-020-00766-5. Epub 2021 Jan 3. Funct Integr Genomics. 2021. PMID: 33389259
-
Comparative RNA-seq analysis of the drought-sensitive lentil (Lens culinaris) root and leaf under short- and long-term water deficits.Funct Integr Genomics. 2019 Sep;19(5):715-727. doi: 10.1007/s10142-019-00675-2. Epub 2019 Apr 18. Funct Integr Genomics. 2019. PMID: 31001704
-
Low molecular weight carbohydrates and abiotic stress tolerance in lentil (Lens culinaris Medikus): a review.Front Plant Sci. 2024 Oct 3;15:1408252. doi: 10.3389/fpls.2024.1408252. eCollection 2024. Front Plant Sci. 2024. PMID: 39421141 Free PMC article. Review.
Cited by
-
Identification of heat responsive genes in pea stipules and anthers through transcriptional profiling.PLoS One. 2021 Nov 4;16(11):e0251167. doi: 10.1371/journal.pone.0251167. eCollection 2021. PLoS One. 2021. PMID: 34735457 Free PMC article.
-
Genome-wide discovery of InDels and validation of PCR-Based InDel markers for earliness in a RIL population and genotypes of lentil (Lens culinaris Medik.).PLoS One. 2024 May 22;19(5):e0302870. doi: 10.1371/journal.pone.0302870. eCollection 2024. PLoS One. 2024. PMID: 38776345 Free PMC article.
-
Identification of heat-tolerant mungbean genotypes through morpho-physiological evaluation and key gene expression analysis.Front Genet. 2024 Oct 10;15:1482956. doi: 10.3389/fgene.2024.1482956. eCollection 2024. Front Genet. 2024. PMID: 39449825 Free PMC article.
-
Enhancing Crop Resilience: The Role of Plant Genetics, Transcription Factors, and Next-Generation Sequencing in Addressing Salt Stress.Int J Mol Sci. 2024 Nov 22;25(23):12537. doi: 10.3390/ijms252312537. Int J Mol Sci. 2024. PMID: 39684248 Free PMC article. Review.
-
Metabolic Mechanisms Underlying Heat and Drought Tolerance in Lentil Accessions: Implications for Stress Tolerance Breeding.Plants (Basel). 2023 Nov 24;12(23):3962. doi: 10.3390/plants12233962. Plants (Basel). 2023. PMID: 38068599 Free PMC article.
References
-
- Singh D, et al. Exploring genetic diversity for heat tolerance among lentil (Lens culinaris Medik.) genotypes of variant habitats by simple sequence repeat markers. Plant Breed. 2016;135:215–223. doi: 10.1111/pbr.12341. - DOI
-
- Roy CD, Tarafdar S, Das M, Kundagrami S. Screening lentil (Lens culinaris Medik.) germplasms for heat tolerance. Trends Biosci. 2012;5:143–146. doi: 10.3389/fpls.2017.00744. - DOI
-
- Sita Kumari, Sehgal Akanksha, Bhandari Kalpna, Kumar Jitendra, Kumar Shiv, Singh Sarvjeet, Siddique Kadambot HM, Nayyar Harsh. Impact of heat stress during seed filling on seed quality and seed yield in lentil (Lens culinaris Medikus) genotypes. Journal of the Science of Food and Agriculture. 2018;98(13):5134–5141. doi: 10.1002/jsfa.9054. - DOI - PubMed
MeSH terms
Substances
LinkOut - more resources
Full Text Sources
Research Materials
Miscellaneous
