. 2019 Sep 10;9(1):13032.
doi: 10.1038/s41598-019-49623-x.

Down-regulation of cyclin-dependent kinase 5 attenuates p53-dependent apoptosis of hippocampal CA1 pyramidal neurons following transient cerebral ischemia

Affiliations

Down-regulation of cyclin-dependent kinase 5 attenuates p53-dependent apoptosis of hippocampal CA1 pyramidal neurons following transient cerebral ischemia

Bich Na Shin et al. Sci Rep. .

Abstract

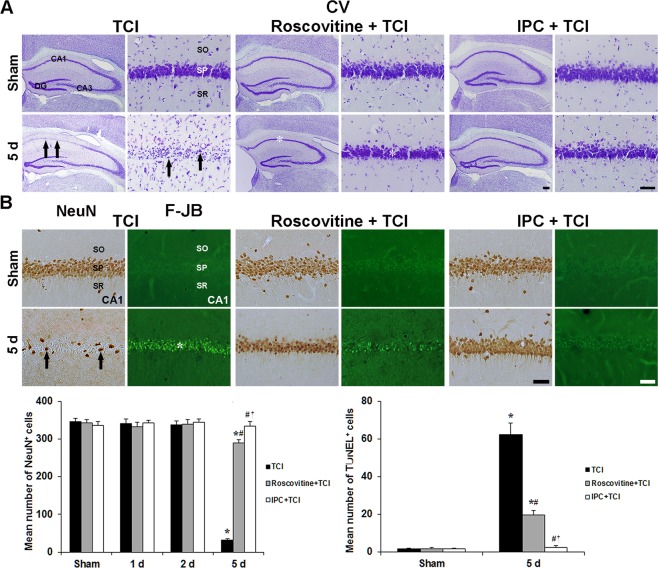
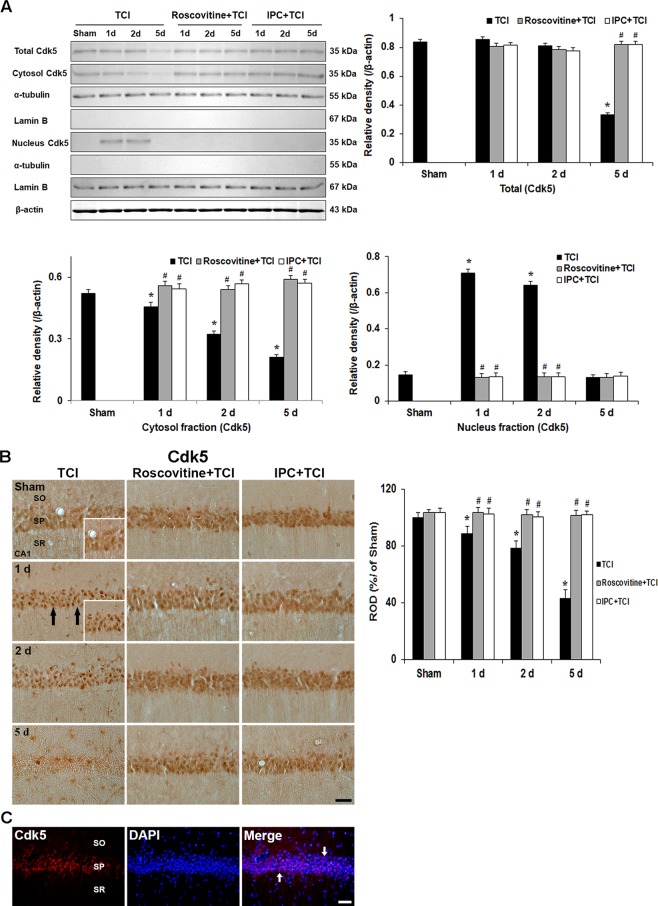
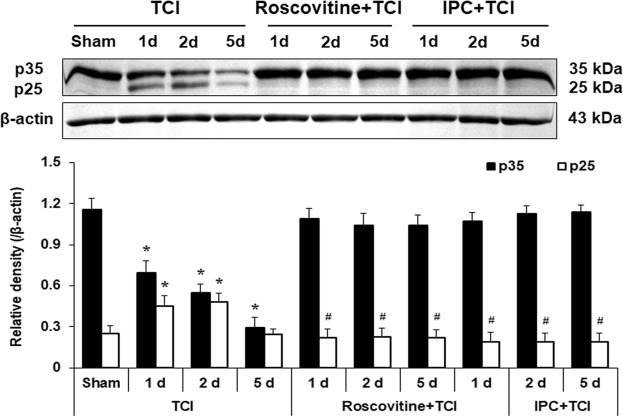
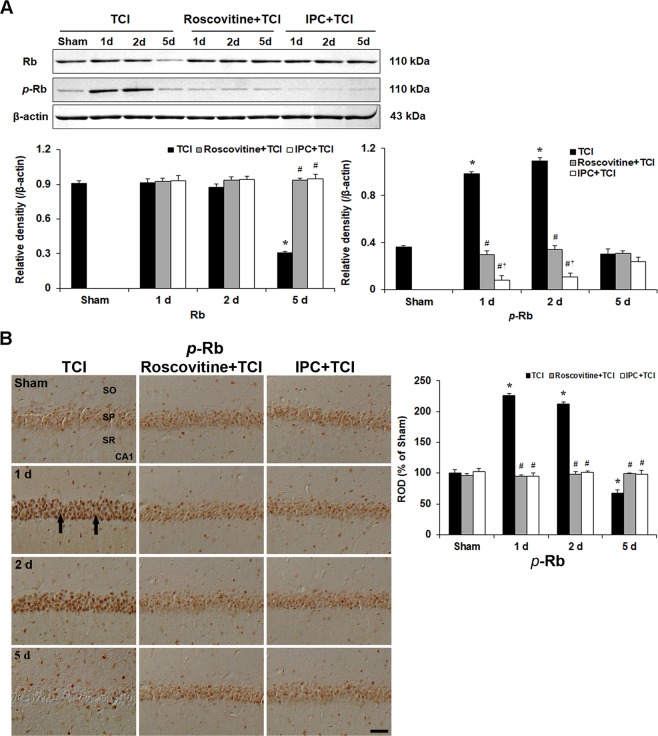
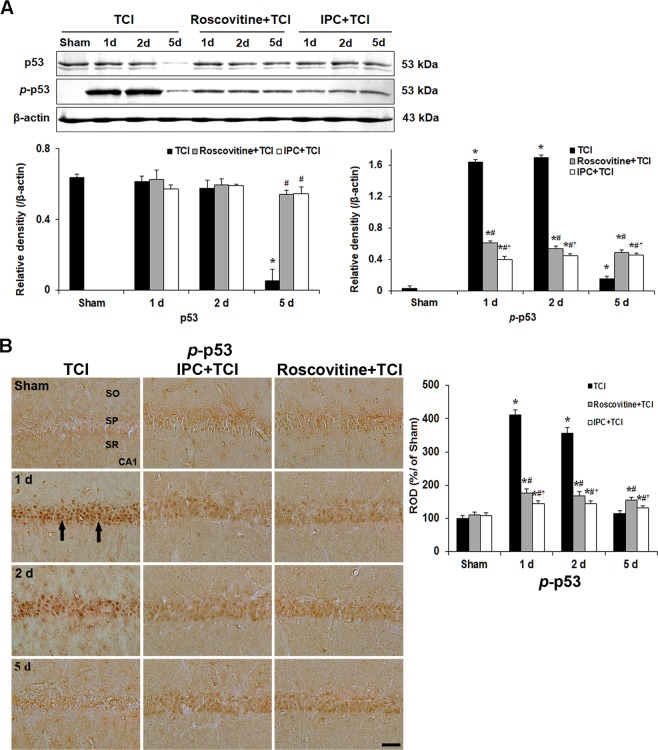
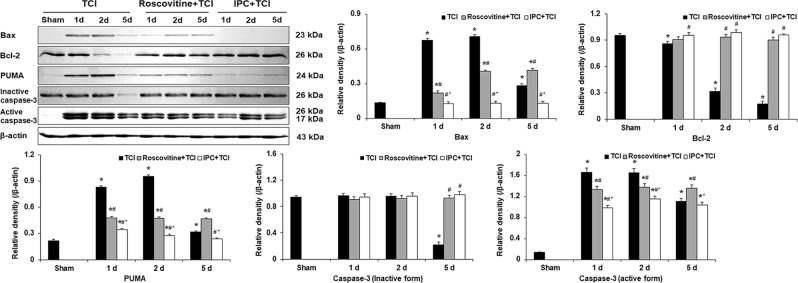
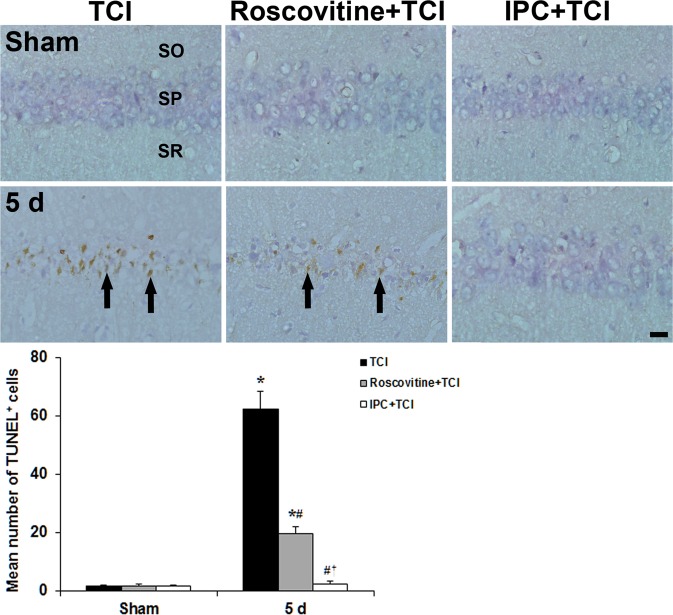
Abnormal activation of cyclin-dependent kinase 5 (Cdk5) is associated with pathophysiological conditions. Ischemic preconditioning (IPC) can provide neuroprotective effects against subsequent lethal ischemic insult. The objective of this study was to determine how Cdk5 and related molecules could affect neuroprotection in the hippocampus of gerbils after with IPC [a 2-min transient cerebral ischemia (TCI)] followed by 5-min subsequent TCI. Hippocampal CA1 pyramidal neurons were dead at 5 days post-TCI. However, treatment with roscovitine (a potent inhibitor of Cdk5) and IPC protected CA1 pyramidal neurons from TCI. Expression levels of Cdk5, p25, phospho (p)-Rb and p-p53 were increased in nuclei of CA1 pyramidal neurons at 1 and 2 days after TCI. However, these expressions were attenuated by roscovitine treatment and IPC. In particular, Cdk5, p-Rb and p-p53 immunoreactivities in their nuclei were decreased. Furthermore, TUNEL-positive CA1 pyramidal neurons were found at 5 days after TCI with increased expression levels of Bax, PUMA, and activated caspase-3. These TUNEL-positive cells and increased molecules were decreased by roscovitine treatment and IPC. Thus, roscovitine treatment and IPC could protect CA1 pyramidal neurons from TCI through down-regulating Cdk5, p25, and p-p53 in their nuclei. These findings indicate that down-regulating Cdk5 might be a key strategy to attenuate p53-dependent apoptosis of CA1 pyramidal neurons following TCI.


Conflict of interest statement

The authors declare no competing interests.

Figures

Figure 1
Figure 1
Roscovitine- and IPC-mediated neuroprotection against TCI. (A) CV staining in the hippocampus of the TCI (1st and 2nd columns), roscovitine + TCI (3rd and 4th columns) and IPC + TCI (5th and 6th columns) groups. CV+ CA1 pyramidal neurons (arrows) are damaged 5 days after TCI; however, CV+ CA1 pyramidal neurons (asterisks) in the roscovitine + TCI and IPC + TCI groups are similar to those in the sham group. Scale bar = 800 µm (1st, 3rd and 5th columns), 50 µm (2nd, 4th and 6th columns). (B) NeuN immunohistochemistry (1st, 3rd and 5th columns) and F-J B histofluorescence staining (2nd, 4th and 6th columns) in the CA1 area of the TCI (1st and 2nd columns), roscovitine + TCI (3rd and 4th columns) and IPC + TCI (5th and 6th columns) groups. In the TCI group, a few NeuN+ (arrows) and many F-J B+ (asterisk) CA1 pyramidal neurons are detected 5 days after TCI. In the roscovitine + TCI and IPC + TCI groups, many NeuN+ pyramidal neurons are observed in the CA1 area; F-J B-positive cells are lower than those in the TCI group. SO, stratum oriens; SP, stratum pyramidale; SR, stratum radiatum. Scale bar = 50 µm. Quantitative graphs for numbers of NeuN+ (left) and F-J B+ (right) CA1 pyramidal neurons. The bars are reported as means ± SEM from three independent experiments (n = 7, *P < 0.05 vs. sham group; #P < 0.05 vs TCI group; P < 0.05 vs roscovitine + TCI group).
Figure 2
Figure 2
Effects of roscovitine and IPC on Cdk5 expression and its translocation after TCI. (A) Western blots of Cdk5 levels in the CA1 area of the TCI, roscovitine + TCI and IPC + TCI groups at sham, 1, 2 and 5 days after TCI. α-Tubulin, lamin B and β-actin densitometric values are used to standardize for cytosol and nucleus protein loading, respectively. Relative band intensity of total cytosol and nucleus Cdk5 level is measured by densitometer. Molecular weight is indicated as kDa on the right side of the immunoblots. The bars are reported as means ± SEM from three independent experiments (n = 7, *P < 0.05 vs. sham group; #P < 0.05 vs TCI group; P < 0.05 vs roscovitine + TCI group). (B) Immunohistochemistry of Cdk5 in the CA1 area of the TCI (left column), roscovitine + TCI (middle column), and IPC + TCI (right column) groups at sham, 1, 2 and 5 days after TCI. Cdk5 immunoreactivity is translocated into nuclei (arrows) in CA1 pyramidal neurons of the TCI group 1 and 2 days after TCI and hardly detected 5 days after TCI. In the roscovitine + sham, IPC + sham, roscovitine + TCI and IPC + TCI groups, Cdk5 immunoreactivity in CA1 pyramidal neurons is similar to that in the sham group. SO, stratum oriens; SP, stratum pyramidale; SR, stratum radiatum. Scale bar = 50 µm. Quantitative graph of Cdk5 immunoreactivity in CA1 pyramidal neurons. A ratio of the ROD was calibrated as %, with the sham group designated as 100%. The bars are reported as means ± SEM from three independent experiments (n = 7, *P < 0.05 vs. sham group; #P < 0.05 vs TCI group; P < 0.05 vs roscovitine + TCI group). (C) Double immunofluorescence staining for Cdk5 (red), DAPI (blue) and merged images at 1 day after TCI. Cdk5+ immunofluorescence in the SP are colocalized with DAPI+ nuclei (white arrows). Scale bar = 50 μm.
Figure 3
Figure 3
Effects of roscovitine and IPC on levels of p35/p25 proteins in the TCI, roscovitine + TCI and IPC + TCI groups at sham, 1, 2 and 5 days after TCI. β-actin is used as a protein loading control. Relative band intensity of p35/p25 levels was measured by densitometer. Levels of p25 protein in the roscovitine + TCI and IPC + TCI groups are significantly low compared with those in the TCI group. Molecular weight is indicated as kDa on the right side of the immunoblots. The bars are reported as means ± SEM from three independent experiments (n = 7, *P < 0.05 vs. sham group; #P < 0.05 vs TCI group; P < 0.05 vs roscovitine + TCI group).
Figure 4
Figure 4
Effects of roscovitine and IPC on Rb expression after TCI. (A) Western blots of total Rb and p-Rb in the CA1 area of the TCI, roscovitine + TCI and IPC + TCI groups at sham, 1, 2 and 5 days after TCI. β-actin is used as a protein loading control. Relative band intensity of Rb and p-Rb level is measured by densitometer. p-Rb level is significantly low in the roscovitine + TCI and IPC + TCI groups compared with the TCI group. Molecular weight is indicated as kDa on the right side of the immunoblots. The bars are reported as means ± SEM from three independent experiments (n = 7, *P < 0.05 vs. sham group; #P < 0.05 vs TCI group; P < 0.05 vs roscovitine + TCI group). (B) p-Rb immunoreactivity in the CA1 area of the TCI (left column), roscovitine + TCI (middle column) and IPC + TCI (right column) groups at sham, 1, 2 and 5 days after TCI. p-Rb immunoreactivity in the TCI group is very strong in nuclei (arrows) of CA1 pyramidal neurons 1 and 2 days after TCI. In the roscovitine + TCI and IPC + TCI groups, the pattern of p-Rb immunoreactivity in CA1 pyramidal neurons was similar to that in the sham group. SO, stratum oriens; SP, stratum pyramidale; SR, stratum radiatum. Scale bar = 50 µm. Quantitative graph of p-Rb immunoreactivity in CA1 pyramidal neurons. A ratio of the ROD was calibrated as %, with the sham group designated as 100%. The bars are reported as means ± SEM from three independent experiments (n = 7, *P < 0.05 vs. sham group; #P < 0.05 vs TCI group; P < 0.05 vs roscovitine + TCI group).
Figure 5
Figure 5
Effects of roscovitine and IPC on p53 phosphorylation and its translocation after TCI. (A) Western blots of p53 and p-p53 in the CA1 area of the TCI, roscovitine + TCI and IPC + TCI groups at sham, 1, 2 and 5 days after TCI. β-actin is used as a protein loading control. Relative band intensity of total p53 and p-p53 level is measured by densitometer. p-p53 levels are significantly low in the roscovitine + TCI and IPC + TCI groups compared with the TCI group. Molecular weight is indicated as kDa on the right side of the immunoblots. The bars are reported as means ± SEM from three independent experiments (n = 7, *P < 0.05 vs. sham group; #P < 0.05 vs TCI group; P < 0.05 vs roscovitine + TCI group). (B) p-p53 immunoreactivity in the CA1 area of the TCI (left column), roscovitine + TCI (middle column) and IPC + TCI (right column) groups at sham, 1, 2 and 5 days after TCI. p-p53 immunoreactivity in the TCI group is very strong in nuclei (arrows) of CA1 pyramidal neurons 1 and 2 days after TCI. In the roscovitine + TCI and IPC + TCI groups, p-p53 immunoreactivity in CA1 pyramidal neurons is moderated 1 and 2 days after TCI, and the immunoreactivity is shown in both nuclei and cytoplasm. SO, stratum oriens; SP, stratum pyramidale; SR, stratum radiatum. Scale bar = 50 µm. Quantitative graph of p-p53 immunoreactivity in CA1 pyramidal neurons. A ratio of the ROD was calibrated as %, with the sham group designated as 100%. The bars are reported as means ± SEM from three independent experiments (n = 7, *P < 0.05 vs. sham group; #P < 0.05 vs TCI group; P < 0.05 vs roscovitine + TCI group).
Figure 6
Figure 6
Effects of roscovitine and IPC on Bax, Bcl-2, PUMA and caspase-3 (inactive and active form) levels in the TCI, roscovitine + TCI and IPC + TCI groups at sham, 1, 2 and 5 days after TCI. β-actin is used as a protein loading control. Relative band intensity of Bax, Bcl-2, PUMA and caspase-3 (inactive and active form) levels is measured by densitometer. Molecular weight is indicated as kDa on the right side of the immunoblots. The bars are reported as means ± SEM from three independent experiments (n = 7, *P < 0.05 vs. sham group; #P < 0.05 vs TCI group; P < 0.05 vs roscovitine + TCI group).
Figure 7
Figure 7
Effect of roscovitine and IPC on apoptosis of CA1 pyramidal neuroins using TUNEL staining in the TCI (left column), roscovitine + TCI (middle column), and IPC + TCI (right column) groups at sham and 5 days after TCI. Many TUNEL+ CA1 pyramidal neurons (arrows) are found in the stratum pyramidale (SP) of the TCI group 5 days after TCI. However, TUNEL+ cells are significantly low in the roscovitine + TCI and IPC + TCI groups compared with the TCI group, respectively. SO, stratum oriens; SR, stratum radiatum. Scale bar = 50 µm. The quantitative graph is shown the percentage of TUNEL+ cells in the SP. The bars are reported as means ± SEM from three independent experiments (n = 7, *P < 0.05 vs. sham group; #P < 0.05 vs TCI group; P < 0.05 vs roscovitine + TCI group).

Similar articles

Cited by

References

    1. Pulsinelli WA, Brierley JB, Plum F. Temporal profile of neuronal damage in a model of transient forebrain ischemia. Ann Neurol. 1982;11:491–498. doi: 10.1002/ana.410110509. - DOI - PubMed
    1. Wegener S, et al. Transient ischemic attacks before ischemic stroke: preconditioning the human brain? A multicenter magnetic resonance imaging study. Stroke. 2004;35:616–621. doi: 10.1161/01.STR.0000115767.17923.6A. - DOI - PubMed
    1. Moncayo J, de Freitas GR, Bogousslavsky J, Altieri M, van Melle G. Do transient ischemic attacks have a neuroprotective effect? Neurology. 2000;54:2089–2094. doi: 10.1212/WNL.55.10.1596. - DOI - PubMed
    1. Dhodda VK, Sailor KA, Bowen KK, Vemuganti R. Putative endogenous mediators of preconditioning-induced ischemic tolerance in rat brain identified by genomic and proteomic analysis. J Neurochem. 2004;89:73–89. doi: 10.1111/j.1471-4159.2004.02316.x. - DOI - PubMed
    1. Stenzel-Poore MP, Stevens SL, King JS, Simon RP. Preconditioning reprograms the response to ischemic injury and primes the emergence of unique endogenous neuroprotective phenotypes: a speculative synthesis. Stroke. 2007;38:680–685. doi: 10.1161/01.STR.0000251444.56487.4c. - DOI - PubMed

Publication types

MeSH terms