

Changes in neurovascular coupling during cycling exercise measured by multi-distance fNIRS: a comparison between endurance athletes and physically active controls
- PMID: 31506708
- PMCID: PMC6794243
- DOI: 10.1007/s00221-019-05646-4
Changes in neurovascular coupling during cycling exercise measured by multi-distance fNIRS: a comparison between endurance athletes and physically active controls
Abstract
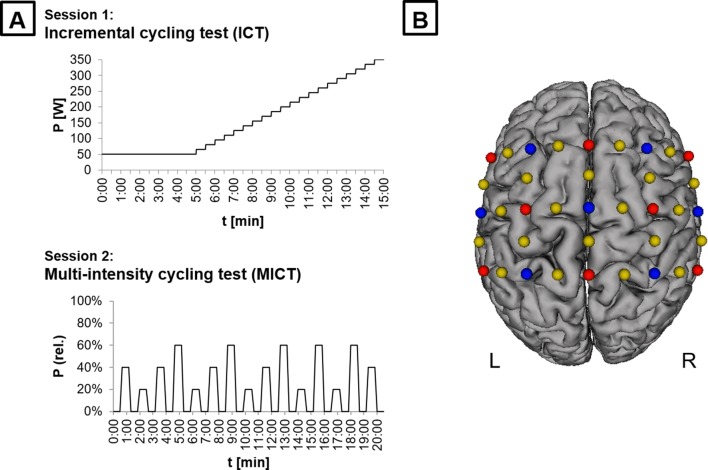
It is well known that endurance exercise modulates the cardiovascular, pulmonary, and musculoskeletal system. However, knowledge about its effects on brain function and structure is rather sparse. Hence, the present study aimed to investigate exercise-dependent adaptations in neurovascular coupling to different intensity levels in motor-related brain regions. Moreover, expertise effects between trained endurance athletes (EA) and active control participants (ACP) during a cycling test were investigated using multi-distance functional near-infrared spectroscopy (fNIRS). Initially, participants performed an incremental cycling test (ICT) to assess peak values of power output (PPO) and cardiorespiratory parameters such as oxygen consumption volume (VO2max) and heart rate (HRmax). In a second session, participants cycled individual intensity levels of 20, 40, and 60% of PPO while measuring cardiorespiratory responses and neurovascular coupling. Our results revealed exercise-induced decreases of deoxygenated hemoglobin (HHb), indicating an increased activation in motor-related brain areas such as primary motor cortex (M1) and premotor cortex (PMC). However, we could not find any differential effects in brain activation between EA and ACP. Future studies should extend this approach using whole-brain configurations and systemic physiological augmented fNIRS measurements, which seems to be of pivotal interest in studies aiming to assess neural activation in a sports-related context.
Keywords: Athletes; Cycling; Neurovascular coupling; Primary motor cortex; fNIRS.
Conflict of interest statement
The authors declare that the research was conducted in the absence of any commercial or financial relationships that could be construed as a potential conflict of interest.
Figures


Similar articles
-
Motor learning in a complex balance task and associated neuroplasticity: a comparison between endurance athletes and nonathletes.J Neurophysiol. 2017 Sep 1;118(3):1849-1860. doi: 10.1152/jn.00419.2017. Epub 2017 Jun 28. J Neurophysiol. 2017. PMID: 28659467 Free PMC article.
-
The Utility of Functional Near-infrared Spectroscopy for Measuring Cortical Activity during Cycling Exercise.Med Sci Sports Exerc. 2019 May;51(5):979-987. doi: 10.1249/MSS.0000000000001875. Med Sci Sports Exerc. 2019. PMID: 30985584
-
Effective Connectivity of Cortical Sensorimotor Networks During Finger Movement Tasks: A Simultaneous fNIRS, fMRI, EEG Study.Brain Topogr. 2016 Sep;29(5):645-60. doi: 10.1007/s10548-016-0507-1. Epub 2016 Jul 20. Brain Topogr. 2016. PMID: 27438589
-
Applied physiology of triathlon.Sports Med. 1995 Apr;19(4):251-67. doi: 10.2165/00007256-199519040-00003. Sports Med. 1995. PMID: 7604198 Review.
-
Speed endurance training is a powerful stimulus for physiological adaptations and performance improvements of athletes.Scand J Med Sci Sports. 2010 Oct;20 Suppl 2:11-23. doi: 10.1111/j.1600-0838.2010.01193.x. Scand J Med Sci Sports. 2010. PMID: 20840558 Review.
Cited by
-
Effects of Cardiorespiratory Fitness on Cerebral Oxygenation in Healthy Adults: A Systematic Review.Front Physiol. 2022 Mar 4;13:838450. doi: 10.3389/fphys.2022.838450. eCollection 2022. Front Physiol. 2022. PMID: 35309063 Free PMC article. Review.
-
Analytical sensitivity factors from distributions of time of flight of photons for near-infrared spectroscopy studies in multilayered turbid media.https://pubmed.ncbi.nlm.nih.gov/39845728/.J Biomed Opt. 2025 Jan;30(1):015002. doi: 10.1117/1.JBO.30.1.015002. Epub 2025 Jan 22. J Biomed Opt. 2025. PMID: 39845728 Free PMC article.
-
A Review of Neurofeedback Training for Improving Sport Performance From the Perspective of User Experience.Front Neurosci. 2021 May 28;15:638369. doi: 10.3389/fnins.2021.638369. eCollection 2021. Front Neurosci. 2021. PMID: 34127921 Free PMC article. Review.
-
Altered Functional Connectivity of Temporoparietal Lobe in Obstructive Sleep Apnea: A Resting-State fNIRS Study.Bioengineering (Basel). 2024 Apr 18;11(4):389. doi: 10.3390/bioengineering11040389. Bioengineering (Basel). 2024. PMID: 38671810 Free PMC article.
-
Data Processing in Functional Near-Infrared Spectroscopy (fNIRS) Motor Control Research.Brain Sci. 2021 May 9;11(5):606. doi: 10.3390/brainsci11050606. Brain Sci. 2021. PMID: 34065136 Free PMC article. Review.
References
Publication types
MeSH terms
LinkOut - more resources
Full Text Sources
Medical
