

Metabolically and immunologically beneficial impact of extra virgin olive and flaxseed oils on composition of gut microbiota in mice
- PMID: 31506767
- PMCID: PMC7413911
- DOI: 10.1007/s00394-019-02088-0
Metabolically and immunologically beneficial impact of extra virgin olive and flaxseed oils on composition of gut microbiota in mice
Abstract
Purpose: Extra virgin olive oil (EVOO) and flaxseed oil (FO) contain a variety of constituents beneficial for chronic inflammation and cardio-metabolic derangement. However, little is known about the impact of EVOO and FO on dysbiosis of gut microbiota, intestinal immunity, and barrier. We, therefore, aimed to assess the impact of EVOO and FO on gut microbiota, mucosal immunity, barrier integrity, and metabolic health in mice.
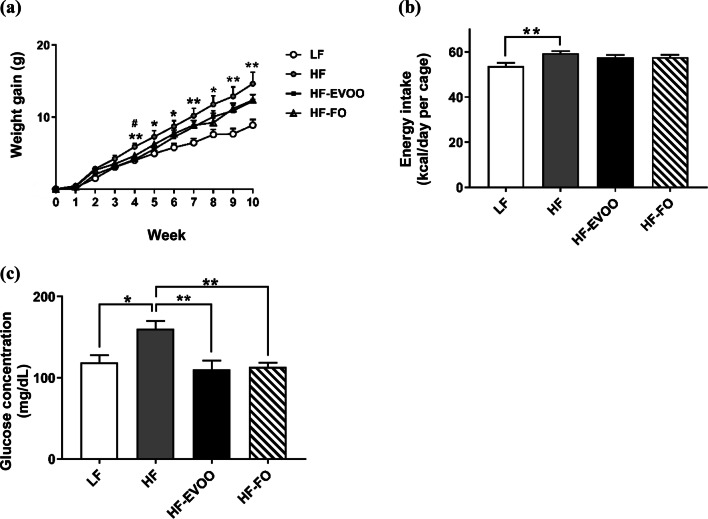
Methods: C57BL/6 J mice were exposed to a low-fat (LF), lard (HF), high fat-extra virgin olive oil (HF-EVOO), or high fat-flaxseed oil (HF-FO) diet for 10 weeks. Gut microbiota assessment was undertaken using 16S rRNA sequencing. Levels of mRNA for genes involved in intestinal inflammation and barrier maintenance in the intestine and bacterial infiltration in the liver were measured by qPCR.
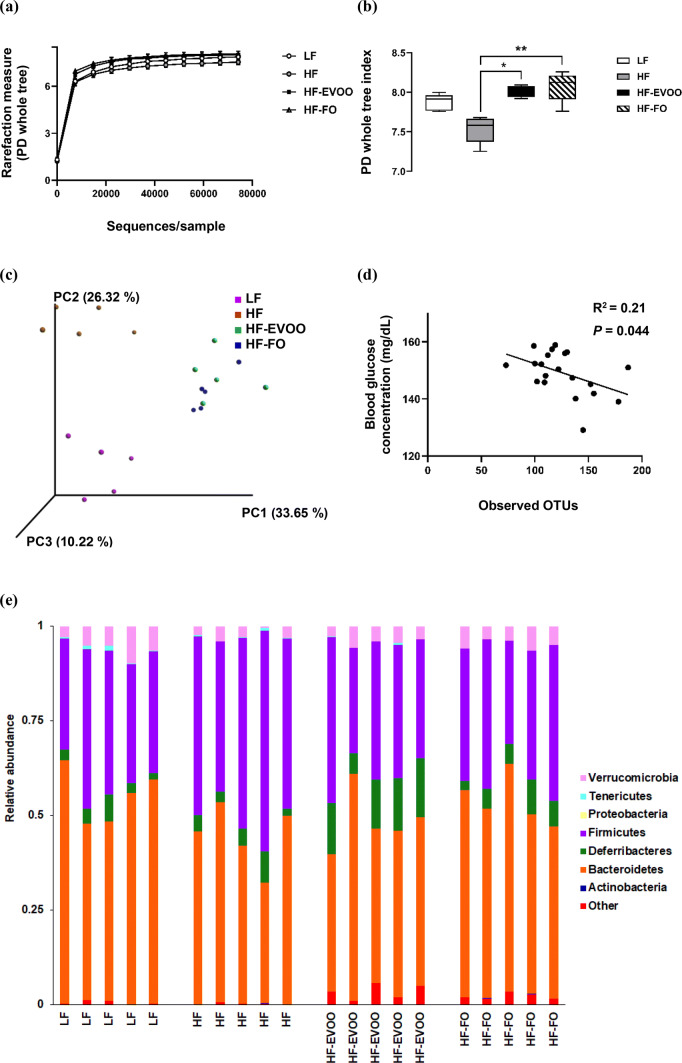
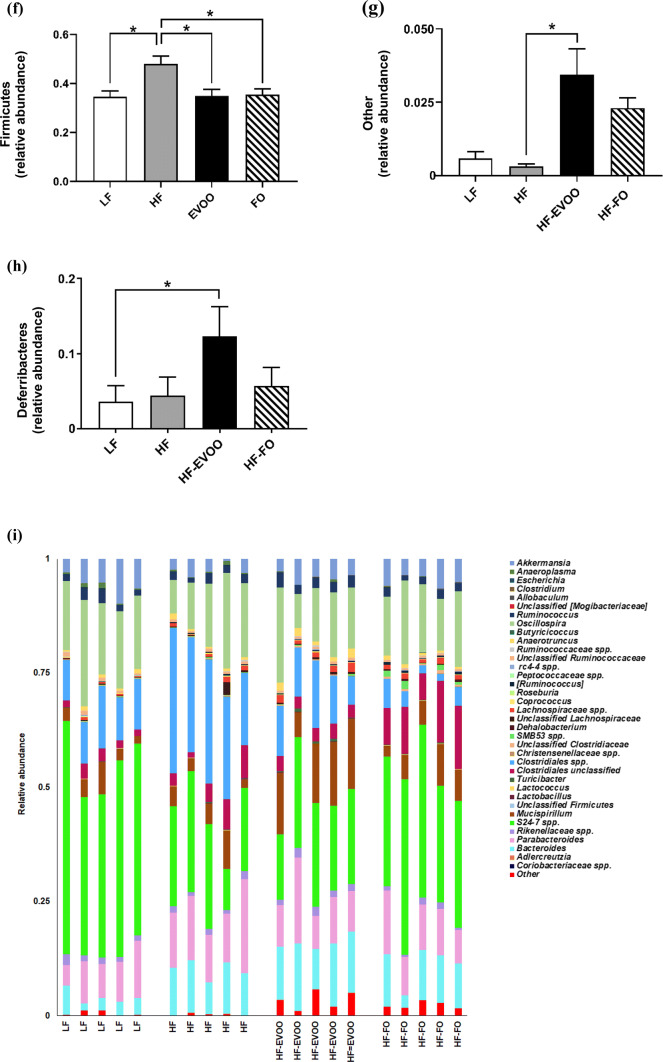
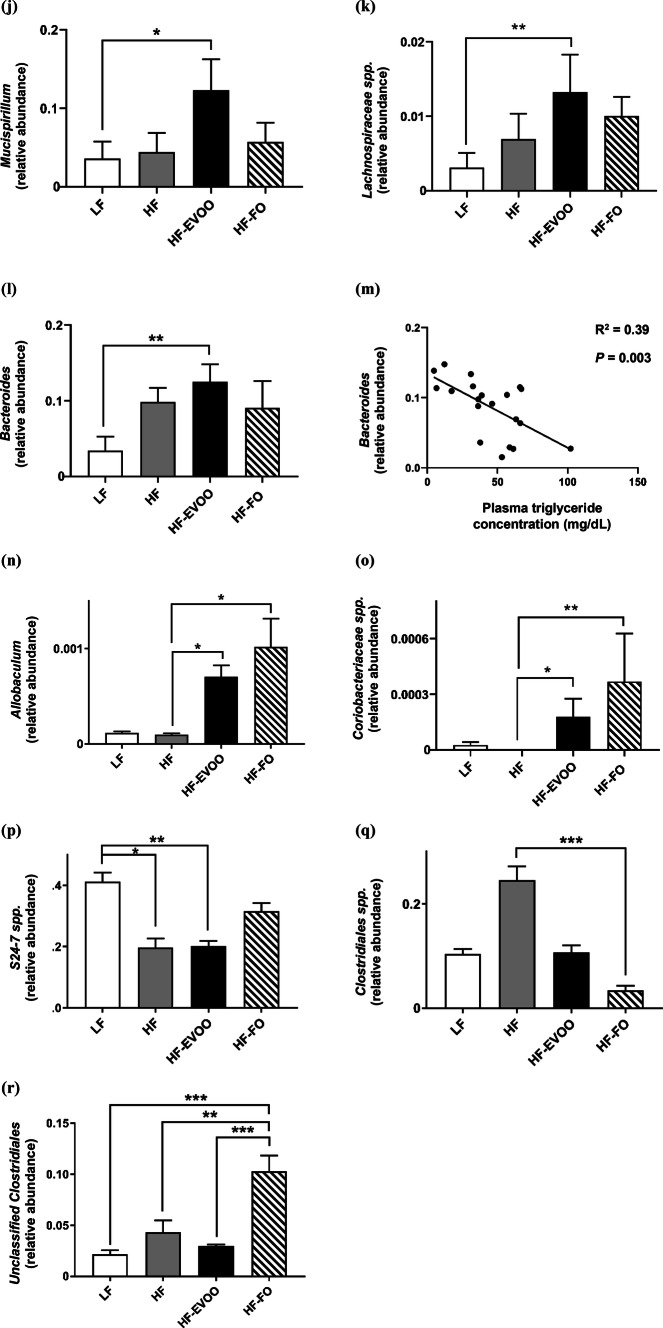
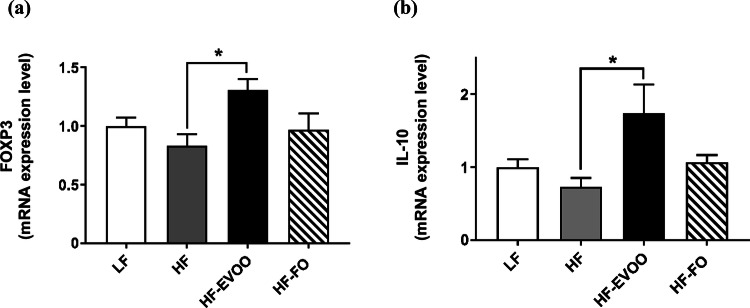
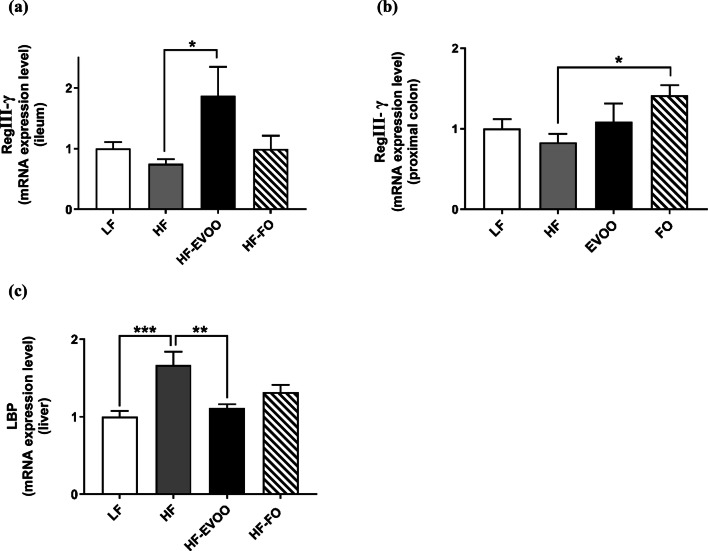
Results: HF-EVOO or HF-FO mice showed greater diversity in gut microbiota as well as a lower abundance of the Firmicutes phylum in comparison with HF mice (P < 0.05). The qPCR analyses revealed that mRNA level of FoxP3, a transcription factor, and IL-10, an inducer of regulatory T cells, was significantly elevated in the intestines of mice-fed HF-EVOO in comparison with mice-fed HF (P < 0.05). The mRNA level of the antimicrobial peptide, RegӀӀӀγ, was markedly elevated in the intestines of HF-EVOO and HF-FO compared with HF group (P < 0.05).
Conclusions: Our data suggest that the consumption of EVOO or FO can beneficially impact gut microbiota, enhance gut immunity, and assist in the preservation of metabolic health in mice.
Keywords: Antimicrobial peptide; Extra virgin olive oil; Flaxseed oil; Gut microbiota; Regulatory T cells.
Conflict of interest statement
The authors have no conflict of interest.
Figures
Similar articles
-
Impact of dietary fatty acids on metabolic activity and host intestinal microbiota composition in C57BL/6J mice.Br J Nutr. 2014 Jun 14;111(11):1905-17. doi: 10.1017/S0007114514000117. Epub 2014 Feb 20. Br J Nutr. 2014. PMID: 24555449
-
Changes in Gut Microbiota Linked to a Reduction in Systolic Blood Pressure in Spontaneously Hypertensive Rats Fed an Extra Virgin Olive Oil-Enriched Diet.Plant Foods Hum Nutr. 2018 Mar;73(1):1-6. doi: 10.1007/s11130-017-0650-1. Plant Foods Hum Nutr. 2018. PMID: 29230708
-
Flaxseed oil ameliorates alcoholic liver disease via anti-inflammation and modulating gut microbiota in mice.Lipids Health Dis. 2017 Feb 22;16(1):44. doi: 10.1186/s12944-017-0431-8. Lipids Health Dis. 2017. PMID: 28228158 Free PMC article.
-
Extra-virgin olive oil and the gut-brain axis: influence on gut microbiota, mucosal immunity, and cardiometabolic and cognitive health.Nutr Rev. 2021 Nov 10;79(12):1362-1374. doi: 10.1093/nutrit/nuaa148. Nutr Rev. 2021. PMID: 33576418 Free PMC article. Review.
-
Correlation between Olive Oil Intake and Gut Microbiota in Colorectal Cancer Prevention.Nutrients. 2022 Sep 10;14(18):3749. doi: 10.3390/nu14183749. Nutrients. 2022. PMID: 36145125 Free PMC article. Review.
Cited by
-
Short-term exposure to synthetic flaxseed lignan LGM2605 alters gut microbiota in mice.Microbiologyopen. 2021 Mar;10(2):e1185. doi: 10.1002/mbo3.1185. Microbiologyopen. 2021. PMID: 33970540 Free PMC article.
-
Dendropanax morbifera Leaf Extracts Improved Alcohol Liver Injury in Association with Changes in the Gut Microbiota of Rats.Antioxidants (Basel). 2020 Sep 24;9(10):911. doi: 10.3390/antiox9100911. Antioxidants (Basel). 2020. PMID: 32987739 Free PMC article.
-
High-Intensity Interval Training and α-Linolenic Acid Supplementation Improve DHA Conversion and Increase the Abundance of Gut Mucosa-Associated Oscillospira Bacteria.Nutrients. 2021 Feb 27;13(3):788. doi: 10.3390/nu13030788. Nutrients. 2021. PMID: 33673609 Free PMC article.
-
Evaluation of the protective and therapeutic effects of extra virgin olive oil rich in phenol in experimental model of neonatal necrotizing enterocolitis by clinical disease score, ınflammation, apoptosis, and oxidative stress markers.Pediatr Surg Int. 2024 Mar 17;40(1):80. doi: 10.1007/s00383-024-05669-1. Pediatr Surg Int. 2024. PMID: 38493431
-
Telomere to telomere flax (Linum usitatissimum L.) genome assembly unlocks insights beyond fatty acid metabolism pathways.Hortic Res. 2025 May 7;12(8):uhaf127. doi: 10.1093/hr/uhaf127. eCollection 2025 Aug. Hortic Res. 2025. PMID: 40673234 Free PMC article.
References
MeSH terms
Substances
Grants and funding
LinkOut - more resources
Full Text Sources
Research Materials
Miscellaneous
