. 2020 Apr;49(4):892-902.
doi: 10.1007/s13280-019-01245-3. Epub 2019 Sep 10.

Offsetting impacts of development on biodiversity and ecosystem services

Affiliations

Offsetting impacts of development on biodiversity and ecosystem services

Laura J Sonter et al. Ambio. 2020 Apr.

Abstract

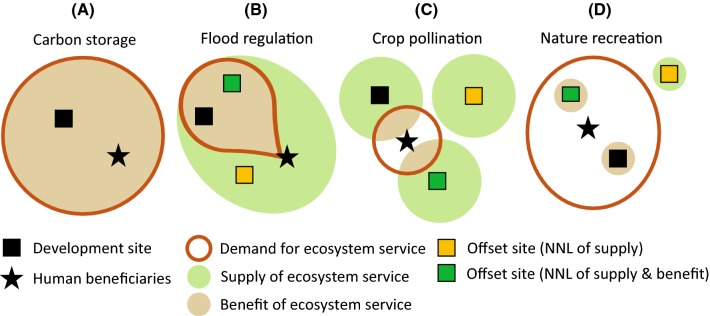
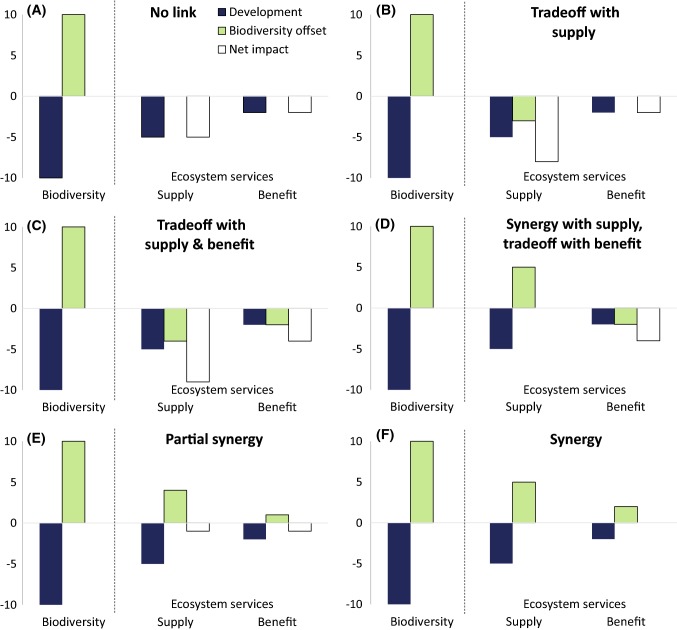
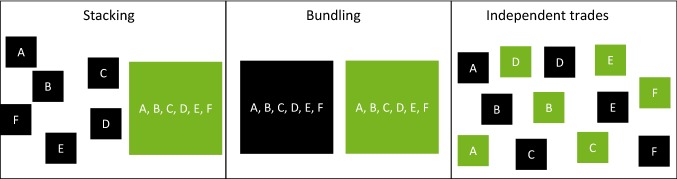
Offsetting-trading losses in one place for commensurate gains in another-is a tool used to mitigate environmental impacts of development. Biodiversity and carbon are the most widely used targets of offsets; however, other ecosystem services are increasingly traded, introducing new risks to the environment and people. Here, we provide guidance on how to "trade with minimal trade-offs"- i.e. how to offset impacts on biodiversity without negatively affecting ecosystem services and vice versa. We briefly survey the literature on offsetting biodiversity, carbon and other ecosystem services, revealing that each subfield addresses unique issues (often overlooking those raised by others) and rarely assesses potential trade-offs. We discuss key differences between offsets that trade biodiversity and those that trade ecosystem services, conceptualise links between these different targets in an offsetting context and describe three broad approaches to manage potential trade-offs. We conclude by proposing a research agenda to strengthen the outcomes of offsetting policies that are emerging internationally.

Keywords: Biodiversity; Ecosystem services; Mitigation hierarchy; Offsetting; Trade-offs.


Figures

Fig. 1
Fig. 1
Spatial distribution of ecosystem service supply, demand, flow and benefit. Figure shows four cases where development causes a loss in service supply and benefit to people. The demand for services is drawn relative to the negatively affected human beneficiaries; it represents the area where people will potentially benefit from services. Ecosystem service supply is drawn relative to development and offset sites; it indicates the area across which services can potentially benefit people. A benefit to humans is therefore achieved where areas of supply and demand intersect (or flow; shaded light brown in the figure). For an offset to achieve NNL in supply and benefit, a fundamental requirement is that it must be located in an area where supply intersects demand. On top of this requirement, the offset must then also deliver gains that are additional. See Appendix S2 for an expanded description of each service (ad)
Fig. 2
Fig. 2
Conceptual framework illustrating consequences of biodiversity offsets on ecosystem services, for the case where development causes losses (negative values) in biodiversity and ecosystem services and offsets generate biodiversity gains (positive values). Net impacts are the difference between losses due to development and gains due to offsetting); they equal 0 when NNL is achieved and are negative when residual losses remain. Graphs show six potential outcomes for ecosystem services, depending on their link to biodiversity at the offset site: a no link, where biodiversity gains do not affect the service supply or benefit (and thus residual losses remain); b trade-offs where biodiversity gains negatively affect supply (and thus net losses for supply are larger than losses caused by development); c trade-offs where biodiversity gains negatively affect supply and benefit; d a combination of synergies and trade-offs, where biodiversity gains positively affect supply (and achieves NNL) but negatively affect benefit and e partial and f full synergies where biodiversity gains positively affect supply and benefit. This series of graphs could also be drawn to illustrate the consequences of ecosystem services offsets on biodiversity, for example when offsets generate equivalent gains in service supply and have trade-offs/synergies with biodiversity
Fig. 3
Fig. 3
Three approaches to offsetting biodiversity and ecosystem services. Black boxes are impact sites, green boxes are offset sites. The letter within each box represents a unique biodiversity components (e.g. a threatened species or ecosystem) or ecosystem services (e.g. carbon storage, water purification)

References

    1. Agrawal A, Nepstad D, Chhatre A. Reducing emissions from deforestation and forest degradation. Annual Review of Environment and Resources. 2011;36:373–396. doi: 10.1146/annurev-environ-042009-094508. - DOI
    1. Bateman IJ, Harwood AR, Mace GM, Watson RT, Abson DJ, Andrews B, Binner A, Crowe A, et al. Bringing ecosystem services into economic decision-making: Land use in the United Kingdom. Science. 2013;341:45–50. doi: 10.1126/science.1234379. - DOI - PubMed
    1. BBOP . Standard on biodiversity offsets. Washington, DC: Business and Biodiversity Offsets Program; 2012.
    1. Benayas JMR, Newton AC, Diaz A, Bullock JM. Enhancement of biodiversity and ecosystem services by ecological restoration: A meta-analysis. Science. 2009;325:1121–1124. doi: 10.1126/science.1172460. - DOI - PubMed
    1. Bidaud C, Schreckenberg K, Jones JPG. The local costs of biodiversity offsets: Comparing standards, policy and practice. Land Use Policy. 2018;77:43–50. doi: 10.1016/j.landusepol.2018.05.003. - DOI

LinkOut - more resources