Effect of fabric on the accuracy of computed tomography-based finite element analyses of the vertebra
- PMID: 31506861
- PMCID: PMC7062572
- DOI: 10.1007/s10237-019-01225-2
Effect of fabric on the accuracy of computed tomography-based finite element analyses of the vertebra
Abstract
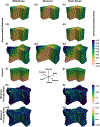
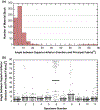
Quantitative computed tomography (QCT)-based finite element (FE) models of the vertebra are widely used in studying spine biomechanics and mechanobiology, but their accuracy has not been fully established. Although the models typically assign material properties based only on local bone mineral density (BMD), the mechanical behavior of trabecular bone also depends on fabric. The goal of this study was to determine the effect of incorporating measurements of fabric on the accuracy of FE predictions of vertebral deformation. Accuracy was assessed by using displacement fields measured via digital volume correlation-applied to time-lapse microcomputed tomography (μCT)-as the gold standard. Two QCT-based FE models were generated from human L1 vertebrae (n = 11): the entire vertebral body and a cuboid-shaped portion of the trabecular centrum [dimensions: (20-30) × (15-20) × (15-20) mm3]. For axial compression boundary conditions, there was no difference (p = 0.40) in the accuracy of the FE-computed displacements for models using material properties based on local values of BMD versus those using material properties based on local values of fabric and volume fraction. However, when using BMD-based material properties, errors were higher for the vertebral-body models (8.4-50.1%) than cuboid models (1.5-19.6%), suggesting that these properties are inaccurate in the peripheral regions of the centrum. Errors also increased when assuming that the cuboid region experienced uniaxial loading during axial compression of the vertebra. These findings indicate that a BMD-based constitutive model is not sufficient for the peripheral region of the vertebral body when seeking accurate QCT-based FE modeling of the vertebra.
Keywords: BMD; Elastic property; Fabric; Finite element analysis; Quantitative computed tomography; Vertebral body.
Conflict of interest statement
Figures


Similar articles
-
Effect of specimen-specific anisotropic material properties in quantitative computed tomography-based finite element analysis of the vertebra.J Biomech Eng. 2013 Oct 1;135(10):101007-11. doi: 10.1115/1.4025179. J Biomech Eng. 2013. PMID: 23942609 Free PMC article.
-
A new material mapping procedure for quantitative computed tomography-based, continuum finite element analyses of the vertebra.J Biomech Eng. 2011 Jul;133(7):071001. doi: 10.1115/1.4004190. J Biomech Eng. 2011. PMID: 21823740 Free PMC article.
-
Accuracy of finite element analyses of CT scans in predictions of vertebral failure patterns under axial compression and anterior flexion.J Biomech. 2016 Jan 25;49(2):267-75. doi: 10.1016/j.jbiomech.2015.12.004. Epub 2015 Dec 11. J Biomech. 2016. PMID: 26792288 Free PMC article.
-
Finite element analysis of the hip and spine based on quantitative computed tomography.Curr Osteoporos Rep. 2013 Jun;11(2):156-62. doi: 10.1007/s11914-013-0141-8. Curr Osteoporos Rep. 2013. PMID: 23504495 Review.
-
Quantitative Computed Tomography (QCT) derived Bone Mineral Density (BMD) in finite element studies: a review of the literature.J Exp Orthop. 2016 Dec;3(1):36. doi: 10.1186/s40634-016-0072-2. Epub 2016 Dec 9. J Exp Orthop. 2016. PMID: 27943224 Free PMC article. Review.
Cited by
-
Slope with Predetermined Shear Plane Stability Predictions under Cyclic Loading with Innovative Time Series Analysis by Mechanical Learning Approach.Sensors (Basel). 2022 Mar 30;22(7):2647. doi: 10.3390/s22072647. Sensors (Basel). 2022. PMID: 35408262 Free PMC article.
-
Trabecular Architecture and Mechanical Heterogeneity Effects on Vertebral Body Strength.Curr Osteoporos Rep. 2020 Dec;18(6):716-726. doi: 10.1007/s11914-020-00640-0. Epub 2020 Nov 20. Curr Osteoporos Rep. 2020. PMID: 33215364 Free PMC article. Review.
-
The Application of Digital Volume Correlation (DVC) to Evaluate Strain Predictions Generated by Finite Element Models of the Osteoarthritic Humeral Head.Ann Biomed Eng. 2020 Dec;48(12):2859-2869. doi: 10.1007/s10439-020-02549-2. Epub 2020 Jun 22. Ann Biomed Eng. 2020. PMID: 32572730 Free PMC article.
-
A novel approach to evaluate the effects of artificial bone focal lesion on the three-dimensional strain distributions within the vertebral body.PLoS One. 2021 Jun 1;16(6):e0251873. doi: 10.1371/journal.pone.0251873. eCollection 2021. PLoS One. 2021. PMID: 34061879 Free PMC article.
References
MeSH terms
Grants and funding
LinkOut - more resources
Full Text Sources
Medical

