. 2019 Sep 24;13(9):9918-9926.
doi: 10.1021/acsnano.9b04231. Epub 2019 Sep 11.

Chameleon-Inspired Strain-Accommodating Smart Skin

Affiliations

Chameleon-Inspired Strain-Accommodating Smart Skin

Yixiao Dong et al. ACS Nano. .

Abstract

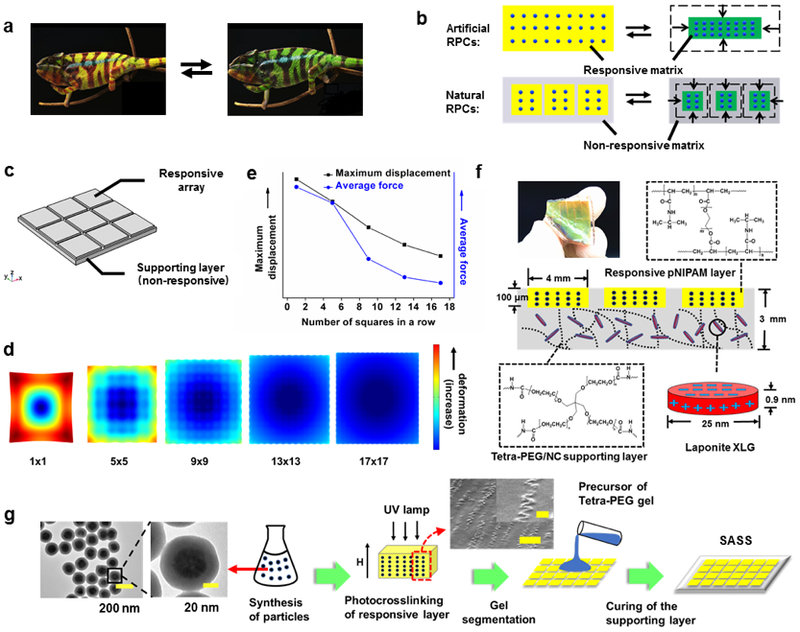
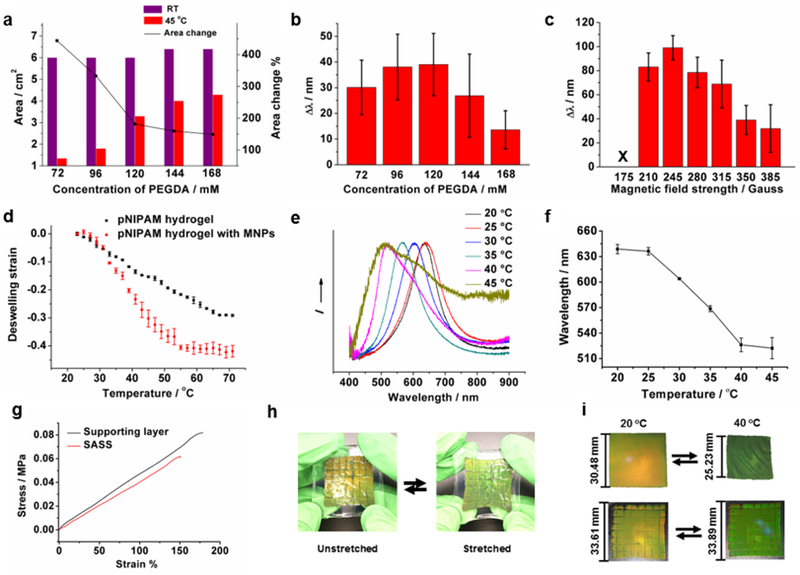
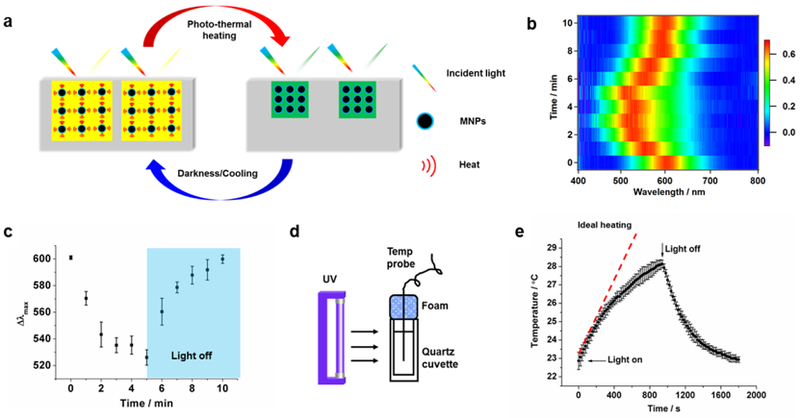
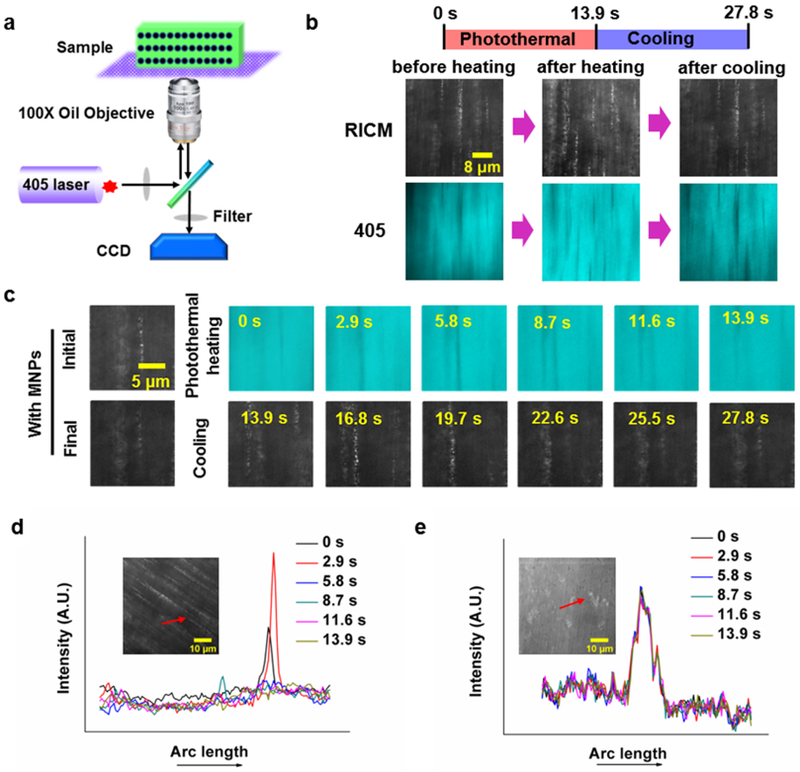
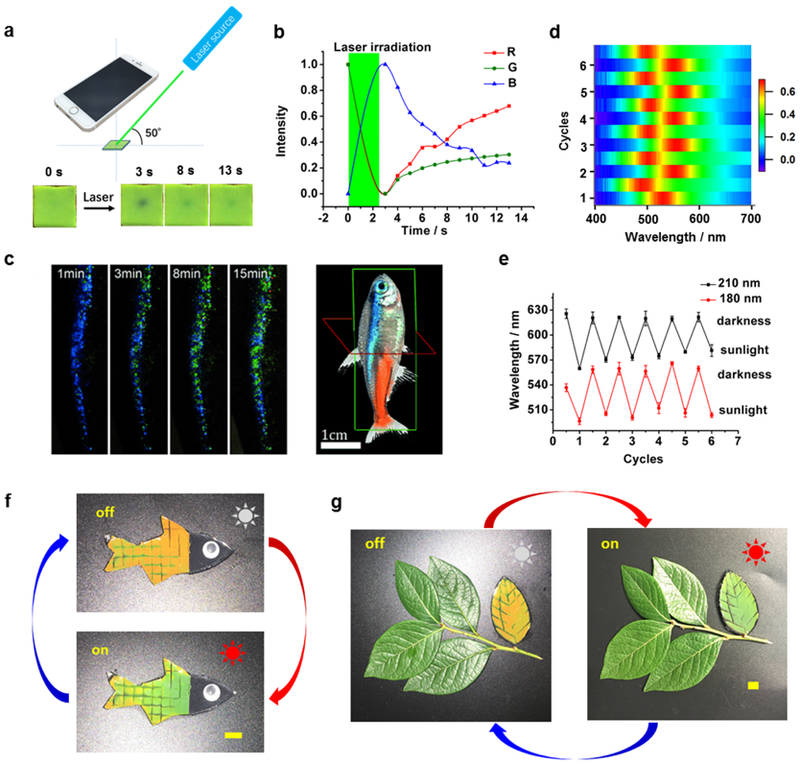
Stimuli-responsive color-changing hydrogels, commonly colored using embedded photonic crystals (PCs), have potential applications ranging from chemical sensing to camouflage and anti-counterfeiting. A major limitation in these PC hydrogels is that they require significant deformation (>20%) in order to change the PC lattice constant and generate an observable chromatic shift (∼100 nm). By analyzing the mechanism of how chameleon skin changes color, we developed a strain-accommodating smart skin (SASS), which maintains near-constant size during chromatic shifting. SASS is composed of two types of hydrogels: a stimuli-responsive, PC-containing hydrogel that is patterned within a second hydrogel with robust mechanical properties, which permits strain accommodation. In contrast to conventional "accordion"-type PC responsive hydrogels, SASS maintains near-constant volume during chromatic shifting. Importantly, SASS materials are stretchable (strain ∼150%), amenable to patterning, spectrally tunable, and responsive to both heat and natural sunlight. We demonstrate examples of using SASS for biomimicry. Our strategy, to embed responsive materials within a mechanically matched scaffolding polymer, provides a general framework to guide the future design of artificial smart skins.

Keywords: chameleon-inspired structural color; chromatic materials; light-responsive hydrogels; magnetic particles; photonic crystals; strain accommodating.


Figures

Figure 1.
Figure 1.
Design and fabrication of strain-accommodating smart skin (SASS) material. (a) Photographs of a chameleon displaying color change (Adapted with permission from Teyssier, J., Saenko, S. V., van der Marel, D. & Milinkovitch, M. C. Nat. Commun. 2015, 6, 6368. Copyright 2015 Springer Nature). (b) Schematic comparing the typical design of artificial responsive PCs to responsive PCs utilized by nature. The dots represent the PC, yellow and green represent the swollen and de-swollen states of the responsive hydrogel, respectively, and gray indicates the supporting, non-responsive polymer matrix. (c) Model used for finite element analysis (FEA) of SASS (also see Supplementary S2). (d) Rendering of FEA model mapping the deformation of a bilayer material with a supporting non-responsive layer and a responsive upper layer divided into sections. (e) Plot of the FEA determined average force and maximal displacement within a plane of the supporting polymer layer as a function of the number of squares in the responsive PC array layer. (f) Photograph and schematic of SASS that includes dimensions and chemical structure of polymers. (g) Flow diagram illustrating the steps used in SASS fabrication, where TEM and SEM images show representative structures of the magnetic nanoparticles and their organization with responsive PC (Scale bar of SEM image: 5 μm and 1μm (inset)).
Figure 2.
Figure 2.
Characterization of SASS. (a) Plot relating the crosslinker (PEGDA) concentration in pNIPAM PC gels to their area before and after heating to 45 °C (a 350 Gauss magnetic field was applied during polymerization). The right y-axis represents the area change % upon heating for each composition. (b) Plot showing the change in reflection λmax for the samples prepared in (a). The Δλmax was determined using reflection spectra of standalone PC films at RT and 45 °C. (c) Plot of reflection Δλmax (collected at RT and 45 °C) for responsive pNIPAM PCs polymerized under different magnetic field strengths. These gels were synthesized with 120 mM PEGDA. (d) Plot of temperature-dependent strain of pNIPAM hydrogels prepared without (black) and with magnetic nanoparticles (red). (e) Normalized reflection spectra of a SASS sample collected at different temperatures. (f) Plot showing λmax of reflectance for SASS samples as a function of temperature. (g) Representative uniaxial tensile measurement of a SASS sample (red) and a sample of a standalone film comprised of the strain-accommodating polymer (black). (h) Photographs demonstrating the elasticity of SASS and its strain-induced color change. (i) Photographs showing the chromatic response of a traditional responsive pNIPAM PC film (upper) triggered by adjusting the temperature (20 °C to 40 °C) compared to the chromatic response of SASS (lower) under the same conditions. The dimensions of the materials in the initial and final states are provided to the left of each image. All error bars represent the standard deviation of three independent measurements.
Figure 3.
Figure 3.
Light responsive behavior of SASS. (a) Schematic of the light responsive mechanism of SASS. Exposure to white light induces photothermal heating and a concomitant spectral shift in the peak absorbance as the spacing within the PC decreases. Cessation of light returns SASS to its original state. (b) 2-Dimensional color map depicting the spectral shift of SASS as a function of time when exposed to a white light LED source (light was on 0-5 min and off 5-10 min). (c) The reflection λmax of illuminated SASS samples as described in b. The error bars represent the standard deviation of three measurements obtained from three different SASS samples. (d) Schematic of equipment set-up used for measuring the photo-thermal conversion efficiency. A UV light source was used to illuminate a dispersion of MNPs while the solution temperature was measured. (e) Plot of solution temperature during exposure of MNP dispersion to UV light as a function of time. The error bar represents the standard deviation from three independent samples. The red dashed line indicates the ideal heating of the dispersion and provides the heating rate of the sample.
Figure 4.
Figure 4.
Microscopic in-situ observation of the light-induced SASS response. (a) Schematic of the microscope and sample set-up for in-situ observation of SASS. Irradiation with a 405 nm laser initiates photothermal heating, and remodels MNP organization. (b) Images of aligned MNPs in the responsive layer captured upon initiation of photothermal heating (0 s), at the end of heating (13.9 s), and at the end of cooling (27.8 s). (c) Time-lapse images of aligned MNPs in the responsive layer collected during photothermal heating with a 405 nm laser and cooling with the laser off. (d) and (e) show plots of line-scans for Fe3O4@SiO2 nanoparticles (~3 nM), and SiO2 nanoparticles (~3 nM) embedded within pNIPAM hydrogels during relaxation following 405 nm excitation for 13.9 s.
Figure 5.
Figure 5.
Potential light-triggered applications of SASS materials. (a) Experimental diagram of SASS optical stimulation along with smart phone camera readout. Lower inset: Photograph of a single 4 mm × 4 mm SASS tile before and after exposure to 532 nm laser. The SASS sample was fabricated using 180 nm diameter particles. (b) Red, green, and blue (RGB) colorimetric analysis of SASS response following a laser pulse. The green area indicates the period of laser irradiation. (c) Time lapse images of the lateral strip of a neon tetra fish after exposure to sunlight (Adapted with permission from Gur, D. et al., Angew. Chem. Int. Ed. 2015, 54, 12426-12430. Copyright 2015 Wiley-VCH). (d) 2-Dimensional color map depicting the spectral shift during six sunlight triggered chromatic shift cycles. (e) Plot showing the chromatic shift of two SASS samples following multiple cycles of exposure to sunlight. The SASS samples were fabricated with two different sizes of MNPs. The maximum peak wavelength for each sample is plotted while oscillating between exposure to sunlight and darkness. (f) A fish-shaped SASS sample before (top) and after (bottom) exposure to sunlight for 10 min. (g) A camouflaged “leaf” fabricated with SASS and positioned alongside real leaves before (left) and after (right) sunlight exposure for 10 min (Scalebars: 1 cm).

References

    1. Teyssier J; Saenko SV; van der Marel D; Milinkovitch MC, Photonic Crystals Cause Active Colour Change in Chameleons. Nat. Commun 2015, 6, 6368. - PMC - PubMed
    1. Gur D; Palmer BA; Leshem B; Oron D; Fratzl P; Weiner S; Addadi L, The Mechanism of Color Change in the Neon Tetra Fish: a Light-Induced Tunable Photonic Crystal Array. Angew. Chem. Int. Ed 2015, 54, 12426–12430. - PubMed
    1. Yoshioka S; Matsuhana B; Tanaka S; Inouye Y; Oshima N; Kinoshita S, Mechanism of Variable Structural Colour in the Neon Tetra: Quantitative Evaluation of the Venetian Blind Model. J. Royal Soc. Interface 2010, 8, 56–66. - PMC - PubMed
    1. Niu S; Li B; Mu Z; Yang M; Zhang J; Han Z; Ren L, Excellent Structure-Based Multifunction of Morpho Butterfly Wings: A Review. J. Bionic. Eng 2015, 12, 170–189.
    1. Tao L; Wenhong P; Shenmin Z; Di Z, Bio-Inspired Fabrication of Stimuli-Responsive Photonic Crystals with Hierarchical Structures and Their Applications. Nanotechnology 2016, 27, 122001. - PubMed

Publication types

Substances