

Speed-Accuracy Tradeoffs in Brain and Behavior: Testing the Independence of P300 and N400 Related Processes in Behavioral Responses to Sentence Categorization
- PMID: 31507392
- PMCID: PMC6718734
- DOI: 10.3389/fnhum.2019.00285
Speed-Accuracy Tradeoffs in Brain and Behavior: Testing the Independence of P300 and N400 Related Processes in Behavioral Responses to Sentence Categorization
Abstract
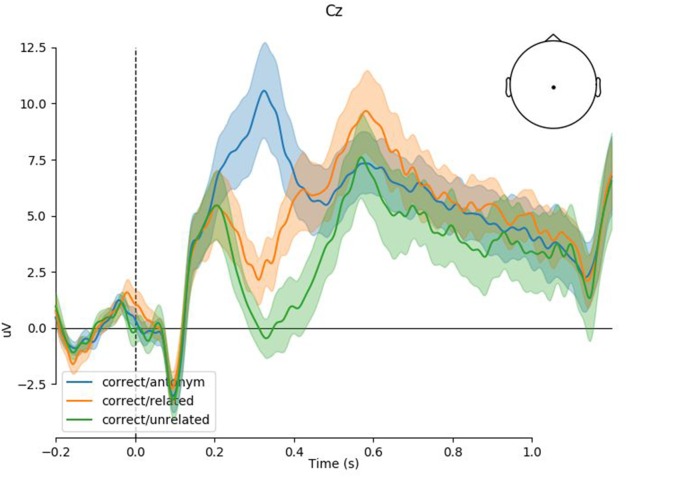
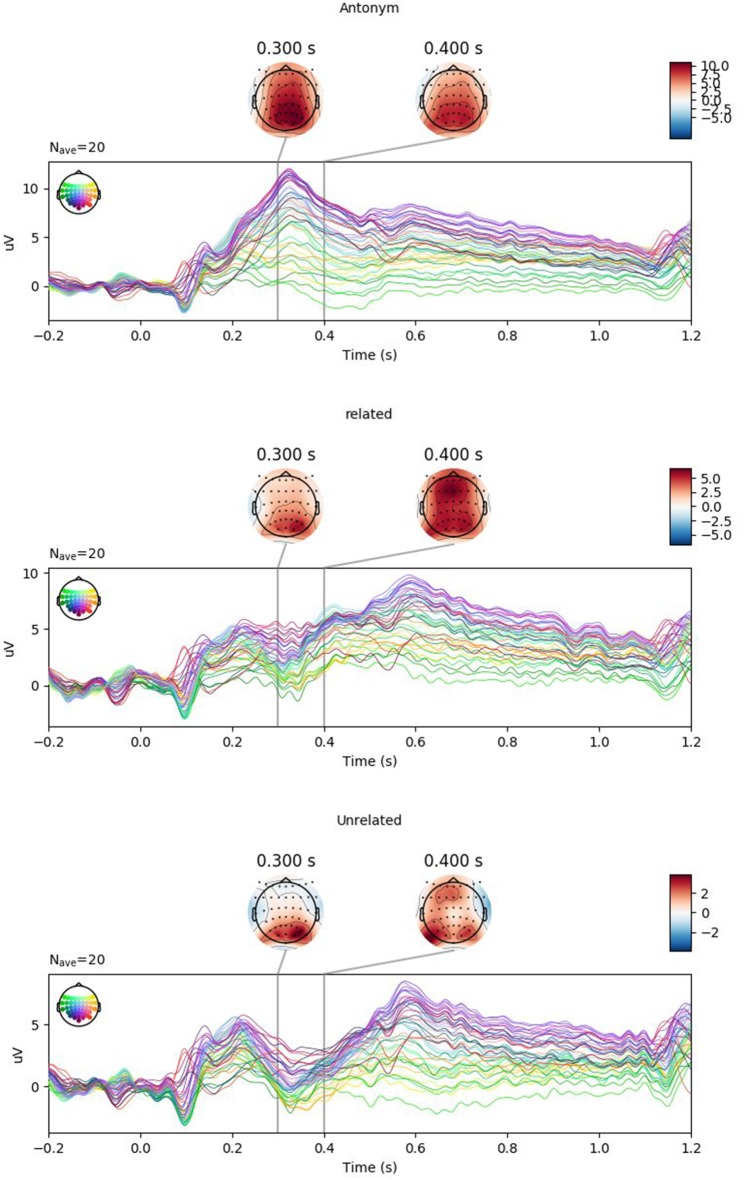
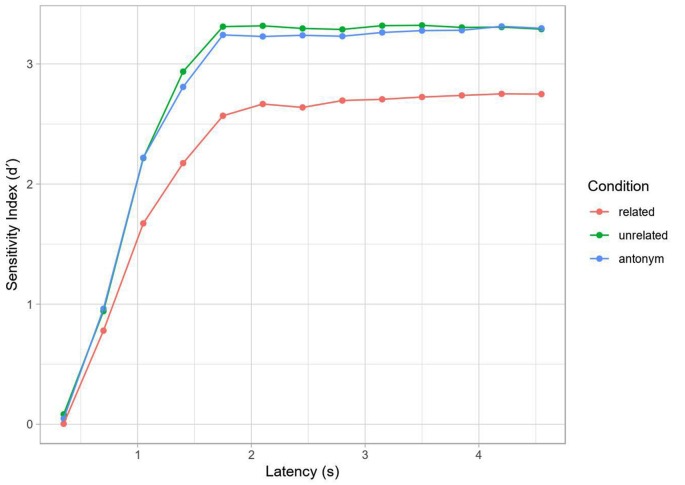
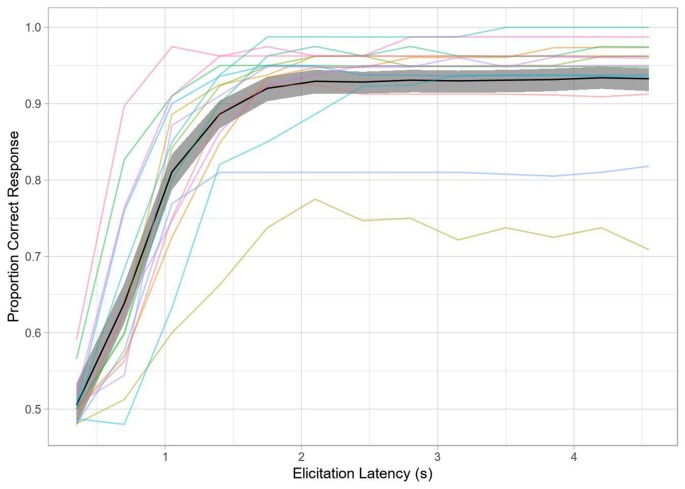
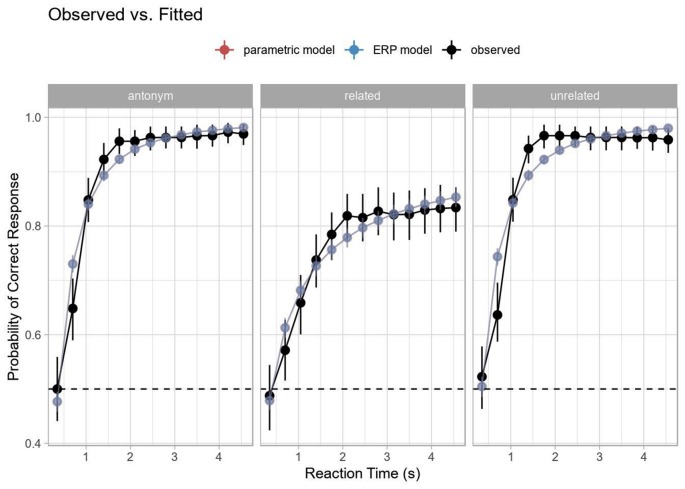
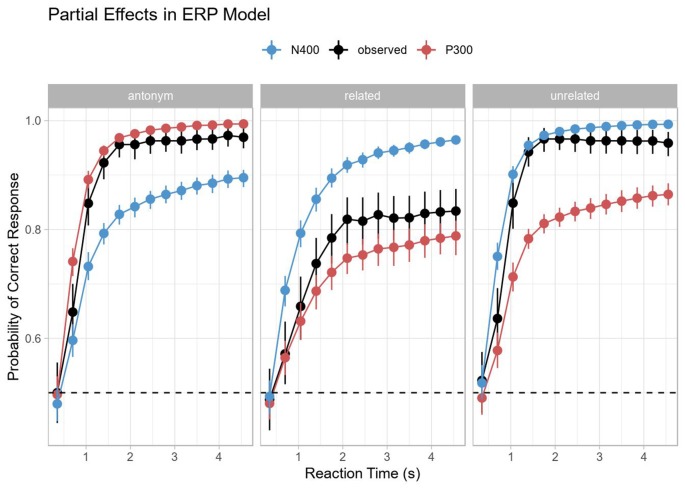
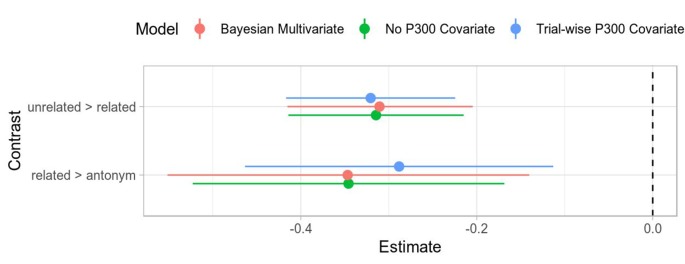
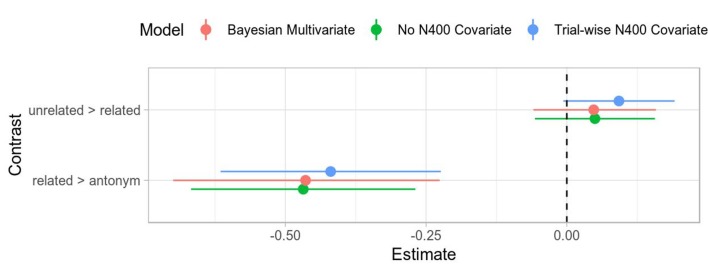
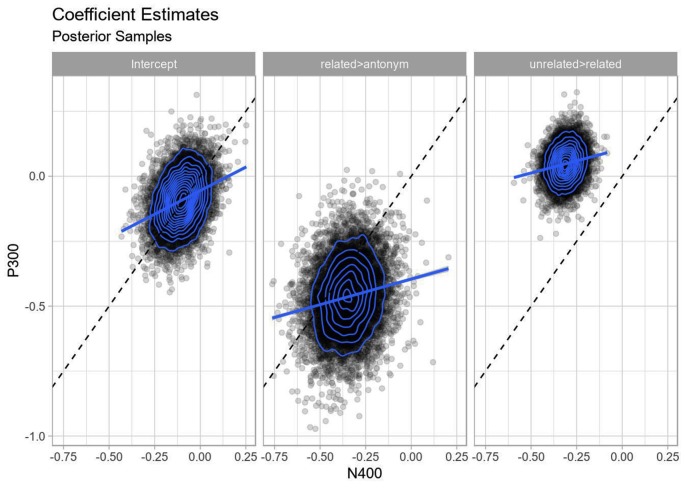
Although the N400 was originally discovered in a paradigm designed to elicit a P300 (Kutas and Hillyard, 1980), its relationship with the P300 and how both overlapping event-related potentials (ERPs) determine behavioral profiles is still elusive. Here we conducted an ERP (N = 20) and a multiple-response speed-accuracy tradeoff (SAT) experiment (N = 16) on distinct participant samples using an antonym paradigm (The opposite of black is white/nice/yellow with acceptability judgment). We hypothesized that SAT profiles incorporate processes of task-related decision-making (P300) and stimulus-related expectation violation (N400). We replicated previous ERP results (Roehm et al., 2007): in the correct condition (white), the expected target elicits a P300, while both expectation violations engender an N400 [reduced for related (yellow) vs. unrelated targets (nice)]. Using multivariate Bayesian mixed-effects models, we modeled the P300 and N400 responses simultaneously and found that correlation between residuals and subject-level random effects of each response window was minimal, suggesting that the components are largely independent. For the SAT data, we found that antonyms and unrelated targets had a similar slope (rate of increase in accuracy over time) and an asymptote at ceiling, while related targets showed both a lower slope and a lower asymptote, reaching only approximately 80% accuracy. Using a GLMM-based approach (Davidson and Martin, 2013), we modeled these dynamics using response time and condition as predictors. Replacing the predictor for condition with the averaged P300 and N400 amplitudes from the ERP experiment, we achieved identical model performance. We then examined the piecewise contribution of the P300 and N400 amplitudes with partial effects (see Hohenstein and Kliegl, 2015). Unsurprisingly, the P300 amplitude was the strongest contributor to the SAT-curve in the antonym condition and the N400 was the strongest contributor in the unrelated condition. In brief, this is the first demonstration of how overlapping ERP responses in one sample of participants predict behavioral SAT profiles of another sample. The P300 and N400 reflect two independent but interacting processes and the competition between these processes is reflected differently in behavioral parameters of speed and accuracy.
Keywords: N400; P300; SAT; mixed-effects modeling; predictive processing; sentence processing.
Figures
Similar articles
-
To predict or not to predict: influences of task and strategy on the processing of semantic relations.J Cogn Neurosci. 2007 Aug;19(8):1259-74. doi: 10.1162/jocn.2007.19.8.1259. J Cogn Neurosci. 2007. PMID: 17651001
-
Age-Related Changes in Predictive Capacity Versus Internal Model Adaptability: Electrophysiological Evidence that Individual Differences Outweigh Effects of Age.Front Aging Neurosci. 2015 Nov 30;7:217. doi: 10.3389/fnagi.2015.00217. eCollection 2015. Front Aging Neurosci. 2015. PMID: 26648865 Free PMC article.
-
Development is in the details: Event-related theta oscillations reveal children and adults verify multiplication facts differently.Psychophysiology. 2023 Jun;60(6):e14255. doi: 10.1111/psyp.14255. Epub 2023 Feb 8. Psychophysiology. 2023. PMID: 36752305 Free PMC article.
-
Gender-selective effects of the P300 and N400 components of the visual evoked potential.Vision Res. 2008 Mar;48(7):917-25. doi: 10.1016/j.visres.2008.01.005. Vision Res. 2008. PMID: 18291436
-
The speed-accuracy tradeoff: history, physiology, methodology, and behavior.Front Neurosci. 2014 Jun 11;8:150. doi: 10.3389/fnins.2014.00150. eCollection 2014. Front Neurosci. 2014. PMID: 24966810 Free PMC article. Review.
Cited by
-
Temporal and time-frequency features of auditory oddball response in distinct subtypes of patients at clinical high risk for psychosis.Eur Arch Psychiatry Clin Neurosci. 2022 Apr;272(3):449-459. doi: 10.1007/s00406-021-01316-1. Epub 2021 Aug 1. Eur Arch Psychiatry Clin Neurosci. 2022. PMID: 34333669
-
Frequency Effects on Spelling Error Recognition: An ERP Study.Front Psychol. 2022 Apr 14;13:834852. doi: 10.3389/fpsyg.2022.834852. eCollection 2022. Front Psychol. 2022. PMID: 35496180 Free PMC article.
-
An ERP study on multiplication and its relationship to phonological processing in children and adults.Psychol Res. 2024 Dec 6;89(1):33. doi: 10.1007/s00426-024-02036-6. Psychol Res. 2024. PMID: 39638885 Free PMC article.
-
Referential Chains Reveal Predictive Processes and Form-to-Function Mapping: An Electroencephalographic Study Using Naturalistic Story Stimuli.Front Psychol. 2021 Aug 19;12:623648. doi: 10.3389/fpsyg.2021.623648. eCollection 2021. Front Psychol. 2021. PMID: 34489770 Free PMC article.
-
Language Processing as a Precursor to Language Change: Evidence From Icelandic.Front Psychol. 2020 Jan 17;10:3013. doi: 10.3389/fpsyg.2019.03013. eCollection 2019. Front Psychol. 2020. PMID: 32010032 Free PMC article.
References
-
- Bates D., Kliegl R., Vasishth S., Baayen H. (2015a). Parsimonious mixed models. arXiv [Preprint]. https://arxiv.org/abs/1506.04967. Accessed May 26, 2018.
LinkOut - more resources
Full Text Sources
Research Materials
Miscellaneous