. 2019 Aug 27:11:225.
doi: 10.3389/fnagi.2019.00225. eCollection 2019.

High-Fat Diet Increases Amylin Accumulation in the Hippocampus and Accelerates Brain Aging in hIAPP Transgenic Mice

Affiliations

High-Fat Diet Increases Amylin Accumulation in the Hippocampus and Accelerates Brain Aging in hIAPP Transgenic Mice

Xiao-Xia Xi et al. Front Aging Neurosci. .

Abstract

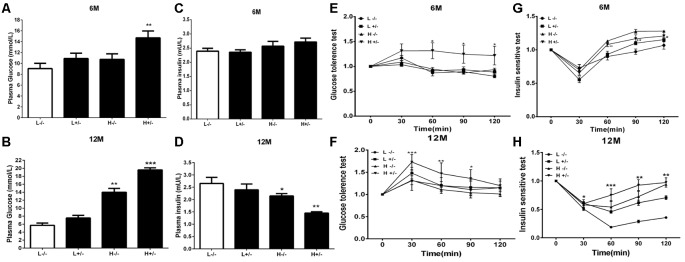
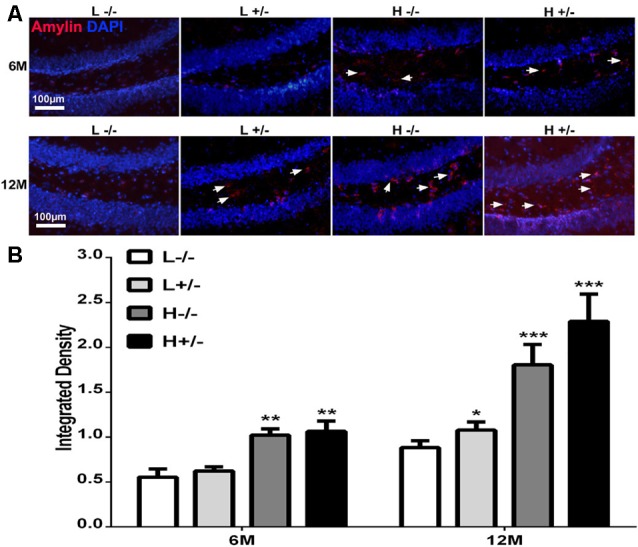
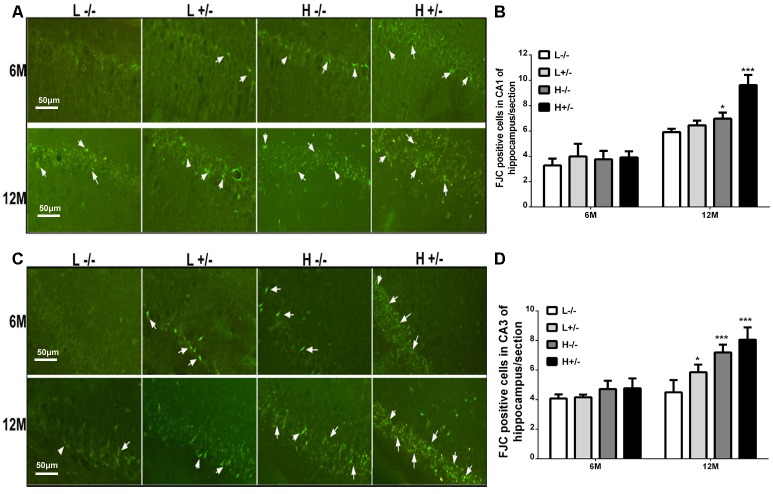
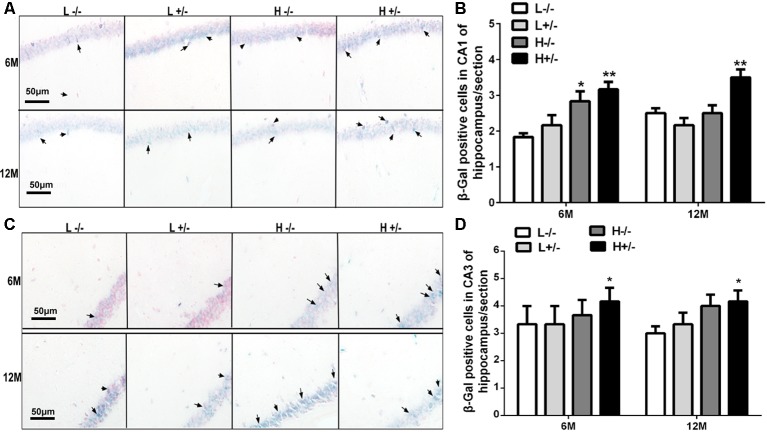
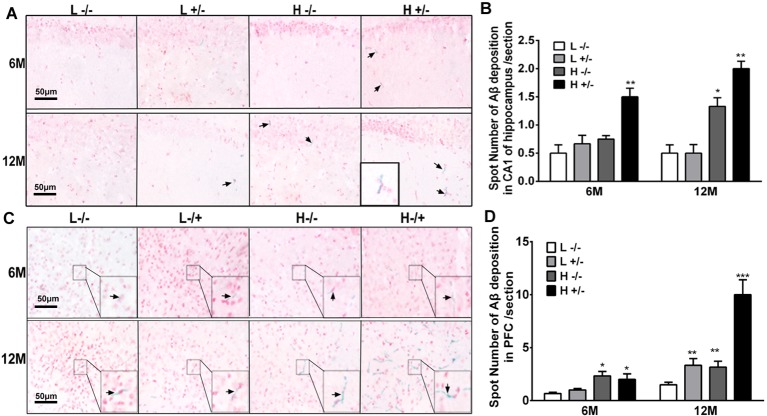
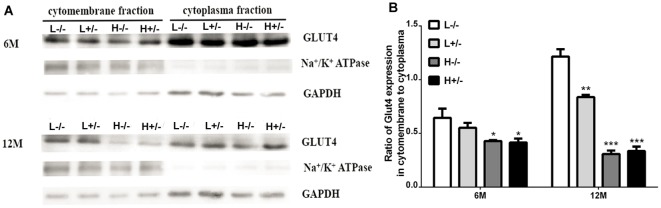
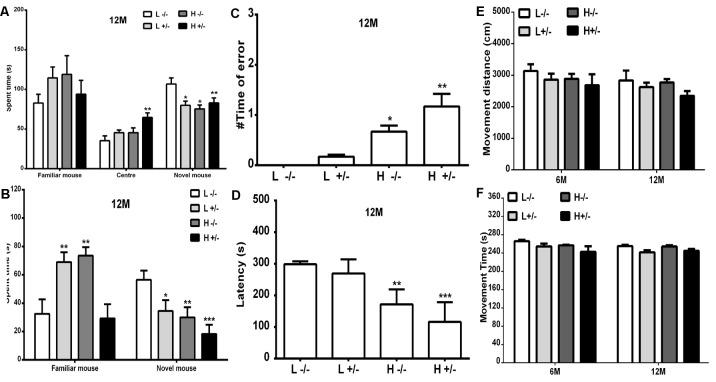
The accumulation of human islet amyloid polypeptide (hIAPP) in pancreatic islets under induction by a high-fat diet plays a critical role in the development of type-2 diabetes mellitus (T2DM). T2DM is a risk factor of late-onset Alzheimer's disease (AD). Nevertheless, whether hIAPP in combination with hyperlipidemia may lead to AD-like pathological changes in the brain remains unclear. hIAPP transgenic mice were fed with a high-fat diet for 6 or 12 months to establish the T2DM model. The accumulation of amylin, the numbers of Fluoro-Jade C (FJC)-positive and β-gal positive cells, and the deposition level of Aβ42 in the hippocampi of the transgenic mice were detected by using brain sections. Cytoplasmic and membrane proteins were extracted from the hippocampi of the transgenic mice, and the ratio of membrane GLUT4 expression to cytoplasmic GLUT4 expression was measured through Western blot analysis. Changes in the cognitive functions of hIAPP transgenic mice after 12 months of feeding with a high-fat diet were evaluated. hIAPP transgenic mice fed with a high-fat diet for 6 or 12 months showed elevated blood glucose levels and insulin resistance; increased amylin accumulation, number of FJC-positive and β-gal positive cells, and Aβ42 deposition in the hippocampi; and reduced membrane GLUT4 expression levels. hIAPP transgenic mice fed with a high-fat diet for 12 months showed reductions in social cognitive ability and passive learning ability. A high-fat diet increased amylin accumulation in the hippocampi of hIAPP transgenic mice, which presented AD-like pathology and behavior characterized by neural degeneration, brain aging, Aβ42 deposition, and impaired glucose utilization and cognition.

Keywords: brain aging; cognition; high-fat diet; hippocampus; human islet amyloid polypeptide.


Figures

Figure 1
Figure 1
Blood biochemistry parameters of human islet amyloid polypeptide (hIAPP−/−) or hIAPP−/+ mice fed with a high/low-fat diet for 6 or 12 months. (A) Plasma glucose content at 6 months after treatment. (B) Plasma glucose content at 12 months after treatment. (C) Plasma insulin content at 6 months after treatment. (D) Plasma insulin content at 12 months after treatment. (E) Results of the glucose tolerance test (GTT) at 6 months after treatment. (F) Results of the GTT at 12 months after treatment. (G) Results of the insulin sensitivity test at 6 months after treatment. (H) Results of the insulin sensitivity test at 12 months after treatment. L−/− denotes hIAPP−/− mice on a low-fat diet; L+/– denotes hIAPP+/– mice on a low-fat diet; H−/− denotes hIAPP−/− mice on a high-fat diet; H+/– denotes hIAPP+/– mice on a high-fat diet. n = 12, *p < 0.05, **p < 0.01, ***p < 0.001 compared with the L−/− group.
Figure 2
Figure 2
Amylin content in the hippocampi of hIAPP−/− and hIAPP+/– mice increased under a high-fat diet. (A) Representative images of amylin-positive particles in the DG of the hippocampus. White arrows indicate positive staining with the amylin antibody, and blue staining indicates the nucleus. (B) Six sections per mouse were stained, and positive particles were analyzed by using ImageJ software. L−/− denotes hIAPP−/− mice on a low-fat diet; L+/– denotes hIAPP+/– mice on a low-fat diet; H−/− denotes hIAPP−/− mice on a high-fat diet; H+/– denotes hIAPP+/– mice on a high-fat diet. n = 6, *p < 0.05, **p < 0.01, ***p < 0.001 compared with the L−/− group.
Figure 3
Figure 3
Neural degeneration in the hippocampi of hIAPP−/− and hIAPP−/+ mice was accelerated by a high-fat diet. (A) Representative images of Fluoro-Jade C (FJC)-positive staining in the hippocampal CA1 regions of hIAPP−/− and hIAPP+/– mice fed with a high/low-fat diet for 6 or 12 months. White arrows indicate FJC-positive cells. (B) Six sections per mouse were stained, and semiquantitative analysis was performed using ImageJ software. (C) Representative images of FJC-positive staining in the hippocampal CA3 regions of hIAPP−/− and hIAPP+/– mice fed with a high/low-fat diet for 6 or 12 months. White arrows indicate FJC-positive cells. (D) Six sections per mouse were stained, and semiquantitative analysis was performed using ImageJ software. L−/− denotes hIAPP−/− mice on a low-fat diet; L+/– denotes hIAPP+/– mice on a low-fat diet; H−/− denotes hIAPP−/− mice on a high-fat diet; H+/– denotes hIAPP+/– mice on a high-fat diet. n = 6, *p < 0.05, ***p < 0.001 compared with the L−/− group.
Figure 4
Figure 4
Nerve cell aging in the hippocampi of hIAPP−/− and hIAPP−/+ mice was accelerated by a high-fat diet. (A) Representative images of β-gal-positive staining in the hippocampal CA1 regions of hIAPP−/− and hIAPP+/– mice fed with a high/low-fat diet for 6 or 12 months. Black arrows indicate β-gal-positive cells. (B) Six sections per mouse were stained, and semiquantitative analysis was performed using ImageJ software. (C) Representative images of β-gal-positive staining in the hippocampal CA3 regions of hIAPP−/− and hIAPP+/– mice treated with a high/low-fat diet for 6 or 12 months. Black arrows indicate β-gal-positive cells. (D) Six sections per mouse were stained, and semiquantitative analysis was performed using ImageJ software. L−/− denotes hIAPP−/− mice on a low-fat diet; L+/– denotes hIAPP+/– mice on a low-fat diet; H−/− denotes hIAPP−/− mice on a high-fat diet; H+/– denotes hIAPP+/– mice on a high-fat diet. n = 6, *p < 0.05, **p < 0.01 compared with the L−/− group.
Figure 5
Figure 5
Aβ42 deposition in the hippocampi and prefrontal cortexes of hIAPP−/− and hIAPP−/+ mice were enhanced by a high-fat diet. (A) Representative images of Aβ42-positive staining in the hippocampal CA1 regions of hIAPP−/− and hIAPP+/– mice treated with a high/low-fat diet for 6 or 12 months. Black arrows indicate Aβ42-positive particles. (B) Six sections per mouse were stained, and semiquantitative analysis was performed using ImageJ software. (C) Representative images of Aβ42-positive staining in the prefrontal cortexes of hIAPP−/− and hIAPP+/– mice treated with a high/low-fat diet for 6 or 12 months. Black arrows indicate Aβ42-positive particles. (D) Six sections per mouse were stained, and semiquantitative analysis was performed using imageJ software. L−/− denotes hIAPP−/− mice on a low-fat diet; L+/– denotes hIAPP+/– mice on a low-fat diet; H−/− denotes hIAPP−/− mice on a high-fat diet; H+/– denotes hIAPP+/– mice on a high-fat diet. n = 6, *p < 0.05, **p < 0.01, ***p < 0.001 compared with the L−/− group.
Figure 6
Figure 6
GLUT4 expression in the membrane fractions of the hippocampi of hIAPP−/− and hIAPP+/– mice was reduced by a high-fat diet. (A) Representative images of Western blot analysis. (B) Quantitative analysis was performed on the basis of gray density by using ImageJ software. L−/− denotes hIAPP−/− mice on a low-fat diet; L+/– denotes hIAPP+/– mice on a low-fat diet; H−/− denotes hIAPP−/− mice on a high-fat diet; H+/– denotes hIAPP+/– mice on a high-fat diet. n = 6, *p < 0.05, **p < 0.01, ***p < 0.001 compared with the L−/− group.
Figure 7
Figure 7
Cognitive ability of hIAPP−/− and hIAPP+/– mice was impaired by a high-fat diet. (A,B) Social learning ability of hIAPP−/− and hIAPP+/– mice fed with a high/low-fat diet for 12 months was tested through the 3-chamber social test. (A) Time spent in different chambers was analyzed through the three-chamber social test (A). (B) Time spent in social areas occupied by familial mouse and novel mouse was analyzed (B). (C,D) Step-down test was used to evaluate the passive learning ability of hIAPP−/− and hIAPP+/– mice treated with a high/low-fat diet for 12 months. Times of error in step-down were analyzed (C). Time spent on the safe platform was analyzed (D). (E,F) Open-field test was performed to evaluate the movement function of hIAPP−/− and hIAPP+/– mice fed with a high/low-fat diet for 6 and 12 months. The movement distance (E) and movement time (F) were analyzed. L−/− denotes hIAPP−/− mice on a low-fat diet; L+/– denotes hIAPP+/– mice on a low-fat diet; H−/− denotes hIAPP−/− mice on a high-fat diet; H+/– denotes hIAPP+/– mice on a high-fat diet. n = 12, *p < 0.05, **p < 0.01, ***p < 0.001 compared with the L−/− group.

Similar articles

Cited by

References

    1. An Y., Varma V. R., Varma S., Casanova R., Dammer E., Pletnikova O., et al. . (2018). Evidence for brain glucose dysregulation in Alzheimer’s disease. Alzheimers Dement. 14, 318–329. 10.1016/j.jalz.2017.09.011 - DOI - PMC - PubMed
    1. Andreetto E., Yan L. M., Tatarek-Nossol M., Velkova A., Frank R., Kapurniotu A. (2010). Identification of hot regions of the Aβ-IAPP interaction interface as high-affinity binding sites in both cross- and self-association. Angew. Chem. Int. Ed Engl. 49, 3081–3085. 10.1002/anie.200904902 - DOI - PubMed
    1. Bailey J., Potter K. J., Verchere C. B., Edelstein-Keshet L., Coombs D. (2011). Reverse engineering an amyloid aggregation pathway with dimensional analysis and scaling. Phys. Biol. 8:066009. 10.1088/1478-3975/8/6/066009 - DOI - PMC - PubMed
    1. Bangen K. J., Werhane M. L., Weigand A. J., Edmonds E. C., Delano-Wood L., Thomas K. R., et al. . (2018). Reduced regional cerebral blood flow relates to poorer cognition in older adults with type 2 diabetes. Front. Aging Neurosci. 10:270. 10.3389/fnagi.2018.00270 - DOI - PMC - PubMed
    1. Banks W. A., Kastin A. J. (1998). Differential permeability of the blood-brain barrier to two pancreatic peptides: insulin and amylin. Peptides 19, 883–889. 10.1016/s0196-9781(98)00018-7 - DOI - PubMed

LinkOut - more resources