

Computed Tomography Severity Index vs. Other Indices in the Prediction of Severity and Mortality in Acute Pancreatitis: A Predictive Accuracy Meta-analysis
- PMID: 31507427
- PMCID: PMC6718714
- DOI: 10.3389/fphys.2019.01002
Computed Tomography Severity Index vs. Other Indices in the Prediction of Severity and Mortality in Acute Pancreatitis: A Predictive Accuracy Meta-analysis
Abstract
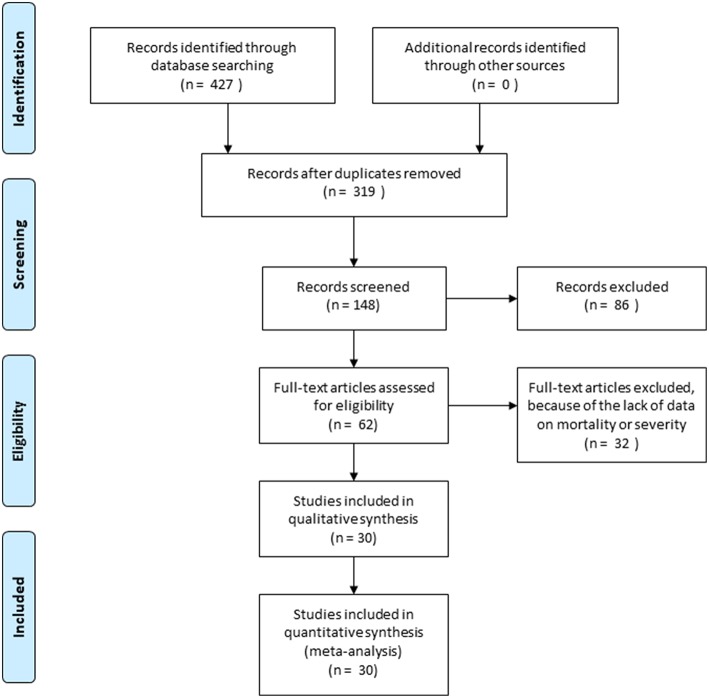
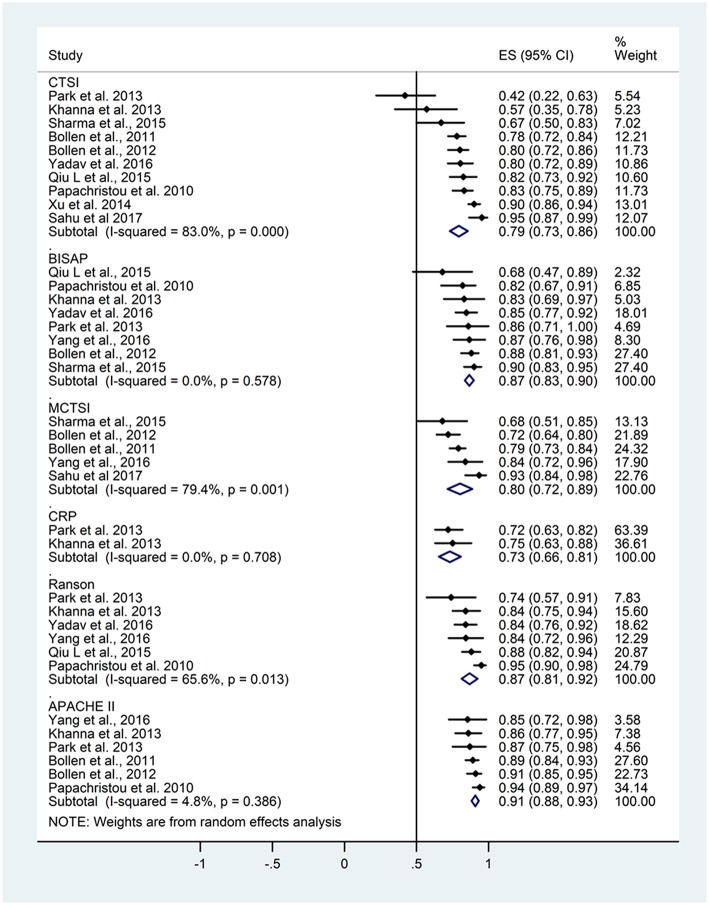
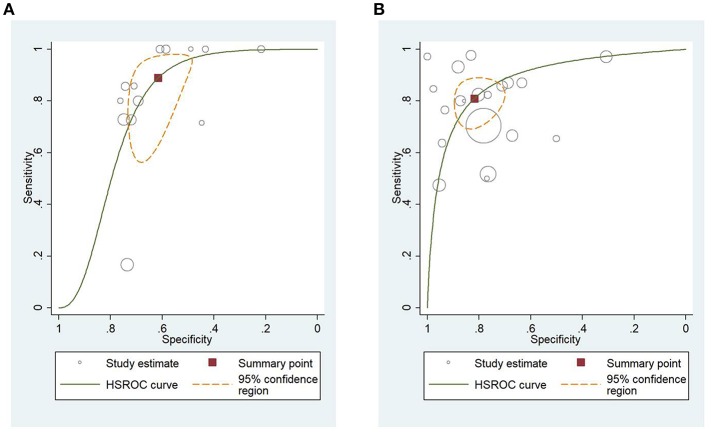
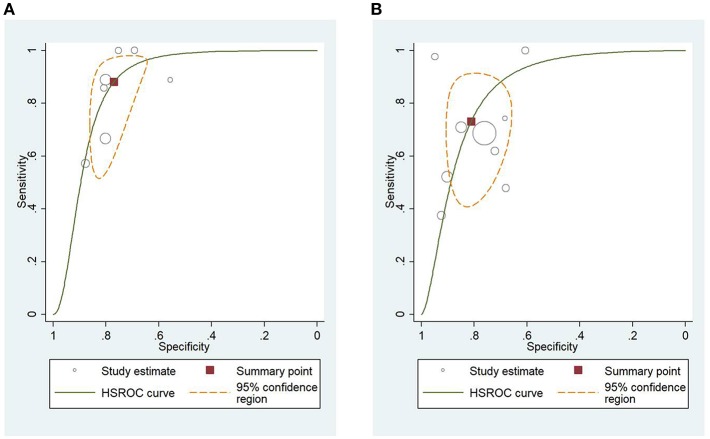
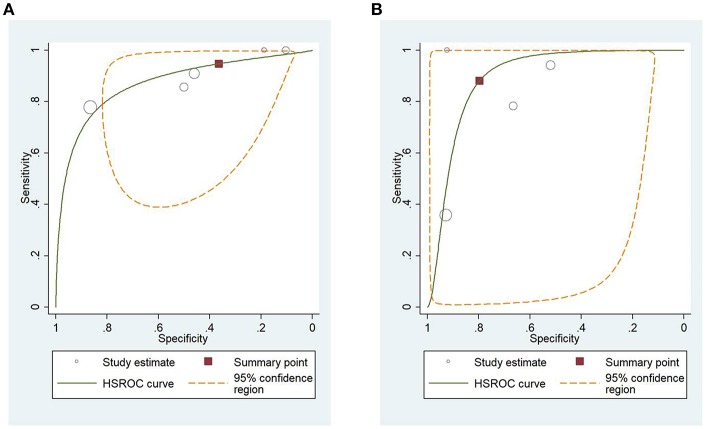
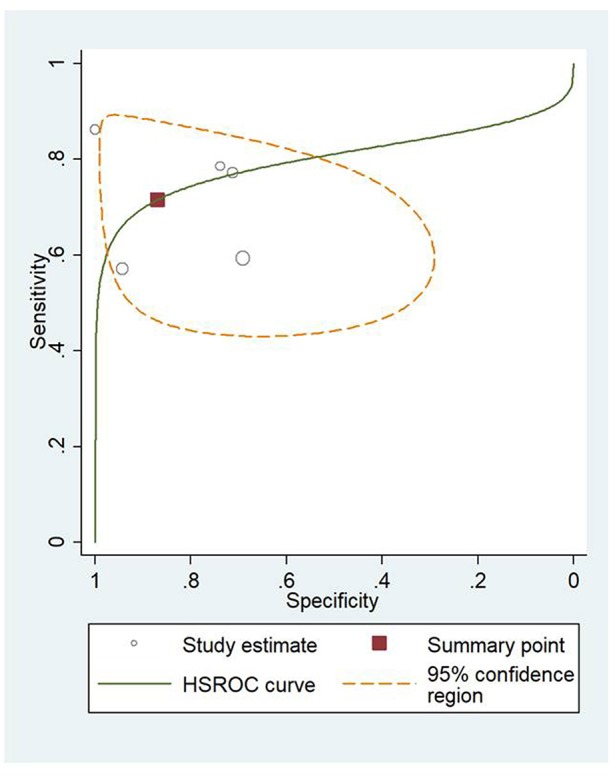
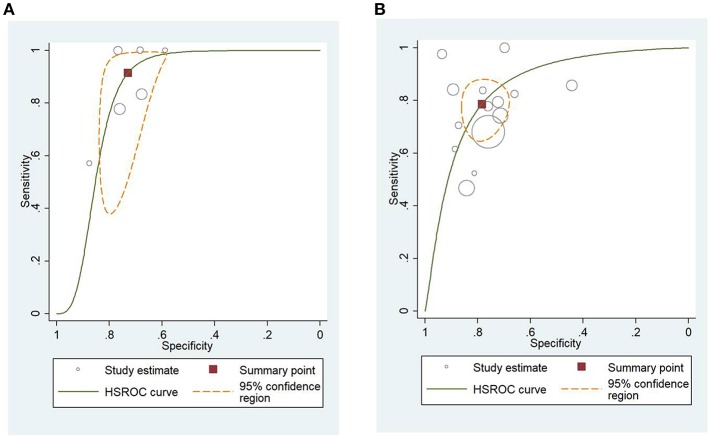
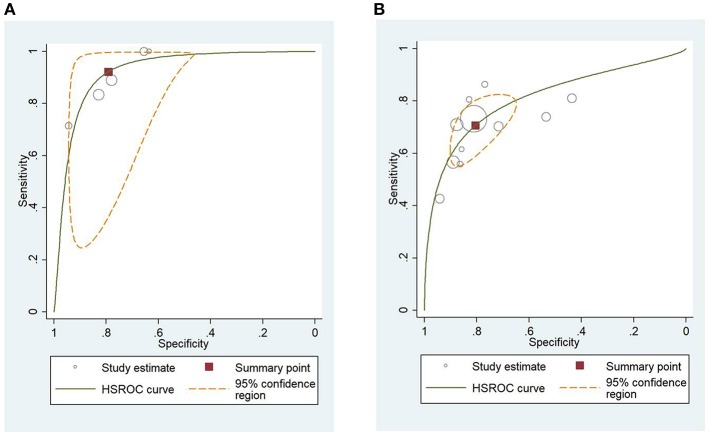
Background: The management of the moderate and severe forms of acute pancreatitis (AP) with necrosis and multiorgan failure remains a challenge. To predict the severity and mortality of AP multiple clinical, laboratory-, and imaging-based scoring systems are available. Aim: To investigate, if the computed tomography severity index (CTSI) can predict the outcomes of AP better than other scoring systems. Methods: A systematic search was performed in three databases: Pubmed, Embase, and the Cochrane Library. Eligible records provided data from consecutive AP cases and used CTSI or modified CTSI (mCTSI) alone or in combination with other prognostic scores [Ranson, bedside index of severity in acute pancreatitis (BISAP), Acute Physiology, and Chronic Health Examination II (APACHE II), C-reactive protein (CRP)] for the evaluation of severity or mortality of AP. Area under the curves (AUCs) with 95% confidence intervals (CIs) were calculated and aggregated with STATA 14 software using the metandi module. Results: Altogether, 30 studies were included in our meta-analysis, which contained the data of 5,988 AP cases. The pooled AUC for the prediction of mortality was 0.79 (CI 0.73-0.86) for CTSI; 0.87 (CI 0.83-0.90) for BISAP; 0.80 (CI 0.72-0.89) for mCTSI; 0.73 (CI 0.66-0.81) for CRP level; 0.87 (CI 0.81-0.92) for the Ranson score; and 0.91 (CI 0.88-0.93) for the APACHE II score. The APACHE II scoring system had significantly higher predictive value for mortality than CTSI and CRP (p = 0.001 and p < 0.001, respectively), while the predictive value of CTSI was not statistically different from that of BISAP, mCTSI, CRP, or Ranson criteria. The AUC for the prediction of severity of AP were 0.80 (CI 0.76-0.85) for CTSI; 0.79, (CI 0.72-0.86) for BISAP; 0.83 (CI 0.75-0.91) for mCTSI; 0.73 (CI 0.64-0.83) for CRP level; 0.81 (CI 0.75-0.87) for Ranson score and 0.80 (CI 0.77-0.83) for APACHE II score. Regarding severity, all tools performed equally. Conclusion: Though APACHE II is the most accurate predictor of mortality, CTSI is a good predictor of both mortality and AP severity. When the CT scan has been performed, CTSI is an easily calculable and informative tool, which should be used more often in routine clinical practice.
Keywords: CT-severity index; accuracy; acute pancreatitis; mortality; severity.
Figures

Similar articles
-
Comparison of scoring systems in predicting the severity of acute pancreatitis.World J Gastroenterol. 2015 Feb 28;21(8):2387-94. doi: 10.3748/wjg.v21.i8.2387. World J Gastroenterol. 2015. PMID: 25741146 Free PMC article.
-
Role of Scoring Systems in Prognosticating Outcomes of Patients With Acute Pancreatitis: A Prospective Cohort Study.Cureus. 2025 Feb 27;17(2):e79738. doi: 10.7759/cureus.79738. eCollection 2025 Feb. Cureus. 2025. PMID: 40161108 Free PMC article.
-
Evaluation of the BISAP scoring system in prognostication of acute pancreatitis - A prospective observational study.Int J Surg. 2018 Jun;54(Pt A):76-81. doi: 10.1016/j.ijsu.2018.04.026. Epub 2018 Apr 21. Int J Surg. 2018. PMID: 29684670
-
Predictive value of the Ranson and BISAP scoring systems for the severity and prognosis of acute pancreatitis: A systematic review and meta-analysis.PLoS One. 2024 Apr 30;19(4):e0302046. doi: 10.1371/journal.pone.0302046. eCollection 2024. PLoS One. 2024. PMID: 38687745 Free PMC article.
-
Clinical usefulness of scoring systems to predict severe acute pancreatitis: A systematic review and meta-analysis with pre and post-test probability assessment.United European Gastroenterol J. 2023 Nov;11(9):825-836. doi: 10.1002/ueg2.12464. Epub 2023 Sep 27. United European Gastroenterol J. 2023. PMID: 37755341 Free PMC article.
Cited by
-
[Classification of pancreatitis].Radiologe. 2021 Jun;61(6):524-531. doi: 10.1007/s00117-021-00855-x. Epub 2021 May 14. Radiologe. 2021. PMID: 33988737 Review. German.
-
Understanding Etiopathogenesis and Clinical Outcomes in Acute Pancreatitis: An Experience From a Tertiary Care Teaching Hospital in Andhra Pradesh.Cureus. 2025 Jul 14;17(7):e87913. doi: 10.7759/cureus.87913. eCollection 2025 Jul. Cureus. 2025. PMID: 40809623 Free PMC article.
-
Diagnosis, severity stratification and management of adult acute pancreatitis-current evidence and controversies.World J Gastrointest Surg. 2022 Nov 27;14(11):1179-1197. doi: 10.4240/wjgs.v14.i11.1179. World J Gastrointest Surg. 2022. PMID: 36504520 Free PMC article. Review.
-
Acute pancreatitis: A review of diagnosis, severity prediction and prognosis assessment from imaging technology, scoring system and artificial intelligence.World J Gastroenterol. 2023 Oct 7;29(37):5268-5291. doi: 10.3748/wjg.v29.i37.5268. World J Gastroenterol. 2023. PMID: 37899784 Free PMC article. Review.
-
A narrative review of acute pancreatitis and its diagnosis, pathogenetic mechanism, and management.Ann Transl Med. 2021 Jan;9(1):69. doi: 10.21037/atm-20-4802. Ann Transl Med. 2021. PMID: 33553362 Free PMC article. Review.
References
-
- Banday I. A., Gattoo I., Khan A. M., Javeed J., Gupta G., Latief M. (2015). Modified computed tomography severity index for evaluation of acute pancreatitis and its correlation with clinical outcome: a tertiary care hospital based observational study. J. Clin. Diagn. Res. 9, TC01–TC05. 10.7860/JCDR/2015/14824.6368 - DOI - PMC - PubMed
-
- Biberoglu S., Koyuncu M., Ozturk D., Toksoz A. C., Cakmakci E., Cakmak F., et al. (2017). Role of computed tomography severity index in acute diagnosis and follow-up of acute pancreatitis. J. Clin. Anal. Med. 8, 106–110. 10.4328/JCAM.4627 - DOI
Publication types
LinkOut - more resources
Full Text Sources
Research Materials
Miscellaneous