Growth and Lipidomic Responses of Juvenile Pacific White Shrimp Litopenaeus vannamei to Low Salinity
- PMID: 31507450
- PMCID: PMC6716509
- DOI: 10.3389/fphys.2019.01087
Growth and Lipidomic Responses of Juvenile Pacific White Shrimp Litopenaeus vannamei to Low Salinity
Abstract
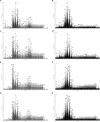
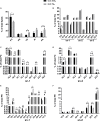
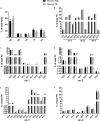
The Pacific white shrimp (Litopenaeus vannamei), a euryhaline penaeid species, can tolerate a wide range of salinities, but little is known on its strategies to cope with low salinity fluctuations from the aspect of lipidomics. Thus, in this study, L. vannamei were grown in two different salinities [3 and 30‰ (control)] for 8 weeks, and then an liquid chromatography (LC)-mass spectrometry (MS)-based lipidomics analysis was performed to reveal the lipid profile differences in gill and muscle. L. vannamei under low salinity had lower weight gain and condition factor than the control shrimp at 30‰, but no differences were found in survival and hepatopancreas index. A higher number of differential lipid metabolites were identified in gill than in muscle in L. vannamei at salinity 3‰ relative to the control shrimp at salinity of 30‰ (159 versus 37), which belonged to 11 and 6 lipids classes, respectively. Of these lipids, phosphatidylcholine (PC), phosphatidylinositol (PI), phosphatidic acid (PA), phosphatidylethanolamine (PE), and triglyceride (TG) were the main lipids in both shrimp gill and muscle, regardless of salinities. Compared with the control shrimp at salinity 30‰, the percentage of PC significantly reduced, but TG and PA significantly increased in gill of shrimp at salinity 3‰. Moreover, the relative fatty acid abundances showed significant changes in L. vannamei between the two salinity groups, but the patterns of the changes were complex and were fatty acid dependent. Neither lipid nor fatty acid composition in muscle was affected by salinity. Further pathway analysis showed that these metabolites were closely related to lipid and fatty acid metabolic pathways. All the findings in this study reveal that the lipid variations are closely related to bio-membrane structure, mitochondrial function, energy supply, or organic osmolyte contents in hemolymph for improving osmoregulatory capacity of L. vannamei under low salinity.
Keywords: Litopenaeus vannamei; gill; growth; lipidomics; muscle; salinity.
Figures


Similar articles
-
Metabolism and growth of juveniles of Litopenaeus vannamei: effect of salinity and dietary carbohydrate levels.J Exp Mar Biol Ecol. 2001 Apr 30;259(1):1-22. doi: 10.1016/s0022-0981(01)00222-2. J Exp Mar Biol Ecol. 2001. PMID: 11325374
-
Transcriptome and Molecular Pathway Analysis of the Hepatopancreas in the Pacific White Shrimp Litopenaeus vannamei under Chronic Low-Salinity Stress.PLoS One. 2015 Jul 6;10(7):e0131503. doi: 10.1371/journal.pone.0131503. eCollection 2015. PLoS One. 2015. PMID: 26147449 Free PMC article.
-
Effects of myo-inositol on growth and biomarkers of environmental stress and metabolic regulation in Pacific white shrimp (Litopenaeus vannamei) reared at low salinity.Comp Biochem Physiol Part D Genomics Proteomics. 2024 Jun;50:101216. doi: 10.1016/j.cbd.2024.101216. Epub 2024 Feb 12. Comp Biochem Physiol Part D Genomics Proteomics. 2024. PMID: 38364652
-
Comparative Transcriptome Analysis in the Hepatopancreas Tissue of Pacific White Shrimp Litopenaeus vannamei Fed Different Lipid Sources at Low Salinity.PLoS One. 2015 Dec 15;10(12):e0144889. doi: 10.1371/journal.pone.0144889. eCollection 2015. PLoS One. 2015. PMID: 26670122 Free PMC article.
-
Comparative proteome analysis of the hepatopancreas from the Pacific white shrimp Litopenaeus vannamei under long-term low salinity stress.J Proteomics. 2017 Jun 6;162:1-10. doi: 10.1016/j.jprot.2017.04.013. Epub 2017 Apr 18. J Proteomics. 2017. PMID: 28435106
Cited by
-
Transcriptome Analysis Reveals the Molecular Response to Salinity Challenge in Larvae of the Giant Freshwater Prawn Macrobrachium rosenbergii.Front Physiol. 2022 Apr 29;13:885035. doi: 10.3389/fphys.2022.885035. eCollection 2022. Front Physiol. 2022. PMID: 35574435 Free PMC article.
-
Insights into the Regulatory Role of MicroRNAs in Penaeus monodon Under Moderately Low Salinity Stress.Biology (Basel). 2025 Apr 18;14(4):440. doi: 10.3390/biology14040440. Biology (Basel). 2025. PMID: 40282305 Free PMC article.
-
Lipidomic profiling reveals biosynthetic relationships between phospholipids and diacylglycerol ethers in the deep-sea soft coral Paragorgia arborea.Sci Rep. 2021 Oct 28;11(1):21285. doi: 10.1038/s41598-021-00876-5. Sci Rep. 2021. PMID: 34711899 Free PMC article.
-
Integrative Application of Transcriptomics and Metabolomics Provides Insights into Unsynchronized Growth in Sea Cucumber (Stichopus monotuberculatus).Int J Mol Sci. 2022 Dec 7;23(24):15478. doi: 10.3390/ijms232415478. Int J Mol Sci. 2022. PMID: 36555118 Free PMC article.
-
Transcriptomic analysis of Penaeus monodon in response to acute and chronic hypotonic stress.Front Vet Sci. 2024 Aug 21;11:1464291. doi: 10.3389/fvets.2024.1464291. eCollection 2024. Front Vet Sci. 2024. PMID: 39234176 Free PMC article.
References
-
- Abou Anni I. S., Bianchini A., Barcarolli I. F., Varela A. S., Robaldo R. B., Tesser M. B., et al. (2016). Salinity influence on growth, osmoregulation and energy turnover in juvenile pompano Trachinotus marginatus cuvier 1832. Aquaculture 455 63–72. 10.1016/j.aquaculture.2016.01.010 - DOI
-
- Athamena A., Brichon G., Trajkovic-Bodennec S., Péqueux A., Chapelle S., Bodennec J., et al. (2011). Salinity regulates N-methylation of phosphatidylethanolamine in euryhaline crustaceans hepatopancreas and exchange of newly-formed phosphatidylcholine with hemolymph. J. Comp. Physiol. B 181 731–740. 10.1007/s00360-011-0562-6 - DOI - PubMed
-
- Bi H., Krausz K. W., Manna S. K., Li F., Johnson C. H., Gonzalez F. J. (2013). Optimization of harvesting, extraction, and analytical protocols for UPLC-ESI-MS-based metabolomic analysis of adherent mammalian cancer cells. Anal. Bioanal. Chem. 405 5279–5289. 10.1007/s00216-013-6927-9 - DOI - PMC - PubMed
LinkOut - more resources
Full Text Sources
Research Materials
Miscellaneous

