

Shifts in the Human Gut Microbiota Structure Caused by Quadruple Helicobacter pylori Eradication Therapy
- PMID: 31507546
- PMCID: PMC6718723
- DOI: 10.3389/fmicb.2019.01902
Shifts in the Human Gut Microbiota Structure Caused by Quadruple Helicobacter pylori Eradication Therapy
Abstract
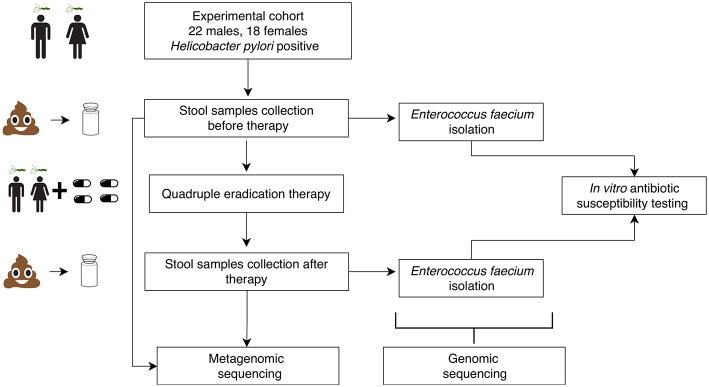
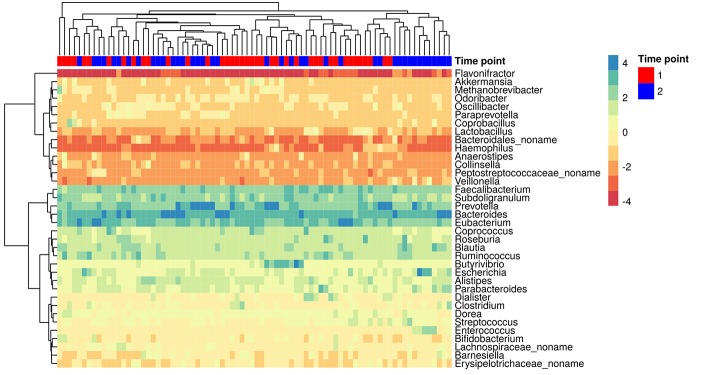
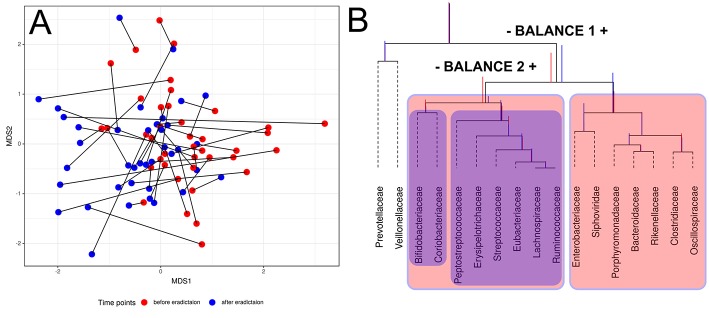
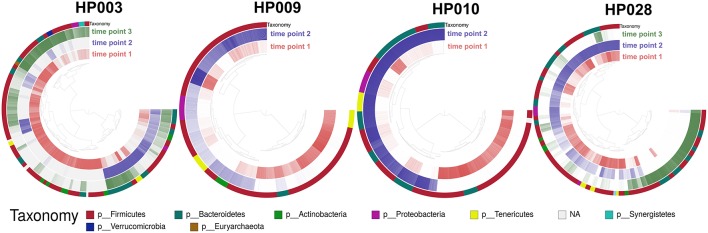
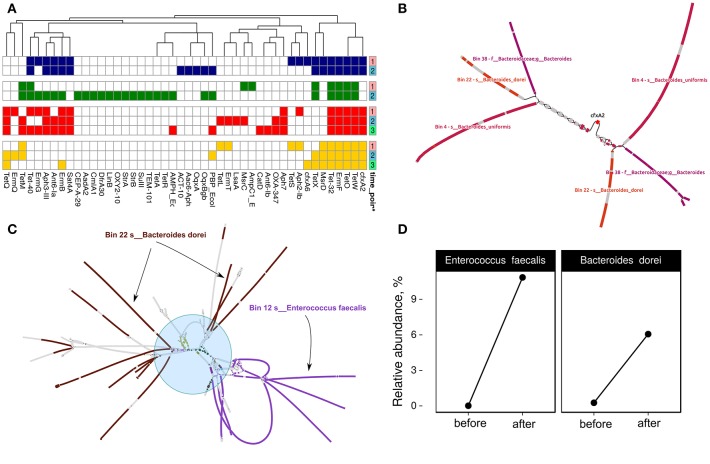
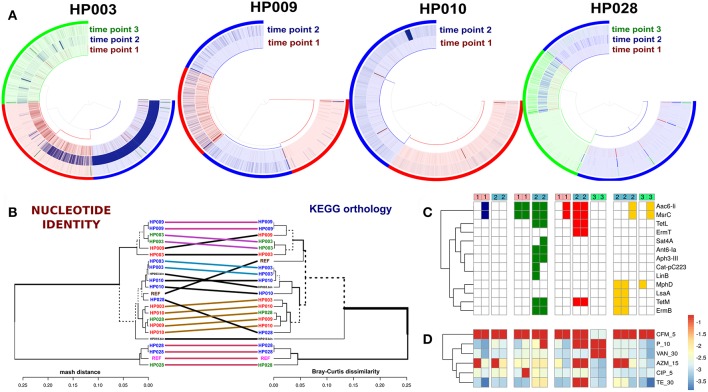
The human gut microbiome plays an important role both in health and disease. Use of antibiotics can alter gut microbiota composition, which can lead to various deleterious events. Here we report a whole genome sequencing metagenomic/genomic study of the intestinal microbiota changes caused by Helicobacter pylori (HP) eradication therapy. Using approaches for metagenomic data analysis we revealed a statistically significant decrease in alpha-diversity and relative abundance of Bifidobacterium adolescentis due to HP eradication therapy, while the relative abundance of Enterococcus faecium increased. We have detected changes in general metagenome resistome profiles as well: after HP eradication therapy, the ermB, CFX group, and tetQ genes were overrepresented, while tetO and tetW genes were underrepresented. We have confirmed these results with genome-resolved metagenomic approaches. MAG (metagenome-assembled genomes) abundance profiles have changed dramatically after HP eradication therapy. Focusing on ermB gene conferring resistance to macrolides, which were included in the HP eradication therapy scheme, we have shown a connection between antibiotic resistance genes (ARGs) and some overrepresented MAGs. Moreover, some E. faecium strains isolated from stool samples obtained after HP eradication have manifested greater antibiotic resistance in vitro in comparison to other isolates, as well as the higher number of ARGs conferring resistance to macrolides and tetracyclines.
Keywords: Helicobacter pylory eradication; antibiotic resistance; enterococci; gut microbiota; horizontal gene transfer; metagenome-assembled genome.
Figures
Similar articles
-
Dynamic changes in antibiotic resistance genes and gut microbiota after Helicobacter pylori eradication therapies.Helicobacter. 2022 Apr;27(2):e12871. doi: 10.1111/hel.12871. Epub 2021 Dec 30. Helicobacter. 2022. PMID: 34969161
-
Second-line levofloxacin-based quadruple therapy versus bismuth-based quadruple therapy for Helicobacter pylori eradication and long-term changes to the gut microbiota and antibiotic resistome: a multicentre, open-label, randomised controlled trial.Lancet Gastroenterol Hepatol. 2023 Mar;8(3):228-241. doi: 10.1016/S2468-1253(22)00384-3. Epub 2022 Dec 19. Lancet Gastroenterol Hepatol. 2023. PMID: 36549320 Clinical Trial.
-
Eradication of Helicobacter pylori reshapes gut microbiota and facilitates the evolution of antimicrobial resistance through gene transfer and genomic mutations in the gut.BMC Microbiol. 2025 Feb 25;25(1):90. doi: 10.1186/s12866-025-03823-w. BMC Microbiol. 2025. PMID: 40000989 Free PMC article.
-
Changes in the human gut microbiota composition caused by Helicobacter pylori eradication therapy: A systematic review and meta-analysis.Helicobacter. 2020 Aug;25(4):e12713. doi: 10.1111/hel.12713. Epub 2020 Jun 9. Helicobacter. 2020. PMID: 32515529
-
Effect of Helicobacter Pylori Eradication on Human Gastric Microbiota: A Systematic Review and Meta-Analysis.Front Cell Infect Microbiol. 2022 May 4;12:899248. doi: 10.3389/fcimb.2022.899248. eCollection 2022. Front Cell Infect Microbiol. 2022. PMID: 35601105 Free PMC article.
Cited by
-
Unveiling the gastric microbiota: implications for gastric carcinogenesis, immune responses, and clinical prospects.J Exp Clin Cancer Res. 2024 Apr 19;43(1):118. doi: 10.1186/s13046-024-03034-7. J Exp Clin Cancer Res. 2024. PMID: 38641815 Free PMC article. Review.
-
Changes in Gastric Corpus Microbiota With Age and After Helicobacter pylori Eradication: A Long-Term Follow-Up Study.Front Microbiol. 2021 Feb 9;11:621879. doi: 10.3389/fmicb.2020.621879. eCollection 2020. Front Microbiol. 2021. PMID: 33633697 Free PMC article.
-
Metagenomic Changes of Gut Microbiota following Treatment of Helicobacter pylori Infection with a Simplified Low-Dose Quadruple Therapy with Bismuth or Lactobacillus reuteri.Nutrients. 2022 Jul 6;14(14):2789. doi: 10.3390/nu14142789. Nutrients. 2022. PMID: 35889746 Free PMC article. Clinical Trial.
-
Whole-Genome-Based Helicobacter pylori Geographic Surveillance: A Visualized and Expandable Webtool.Front Microbiol. 2021 Aug 2;12:687259. doi: 10.3389/fmicb.2021.687259. eCollection 2021. Front Microbiol. 2021. PMID: 34408729 Free PMC article.
-
Development of qPCR platform with probes for quantifying prevalent and biomedically relevant human gut microbial taxa.Mol Cell Probes. 2020 Aug;52:101570. doi: 10.1016/j.mcp.2020.101570. Epub 2020 Apr 15. Mol Cell Probes. 2020. PMID: 32304824 Free PMC article.
References
-
- Aitchison J. (1992). On criteria for measures of compositional difference. Math. Geol. 24, 365–379.
-
- Aitchison J., Pawlowsky-Glahn V. (1997). The one-hour course in compositional data analysis or compositional data analysis is simple, in Proceedings of IAMG (Barcelona: ), 3–35.
-
- Barnum T. P., Figueroa I. A., Carlström C. I., Lucas L. N., Engelbrektson A. L., Coates J. D. (2018). Genome-resolved metagenomics identifies genetic mobility, metabolic interactions, and unexpected diversity in perchlorate-reducing communities. ISME J. 12, 1568–1581. 10.1038/s41396-018-0081-5 - DOI - PMC - PubMed
LinkOut - more resources
Full Text Sources
Research Materials
Miscellaneous