. 2019 Aug 27:10:1928.
doi: 10.3389/fmicb.2019.01928. eCollection 2019.

New Halonotius Species Provide Genomics-Based Insights Into Cobalamin Synthesis in Haloarchaea

Affiliations

New Halonotius Species Provide Genomics-Based Insights Into Cobalamin Synthesis in Haloarchaea

Ana Durán-Viseras et al. Front Microbiol. .

Abstract

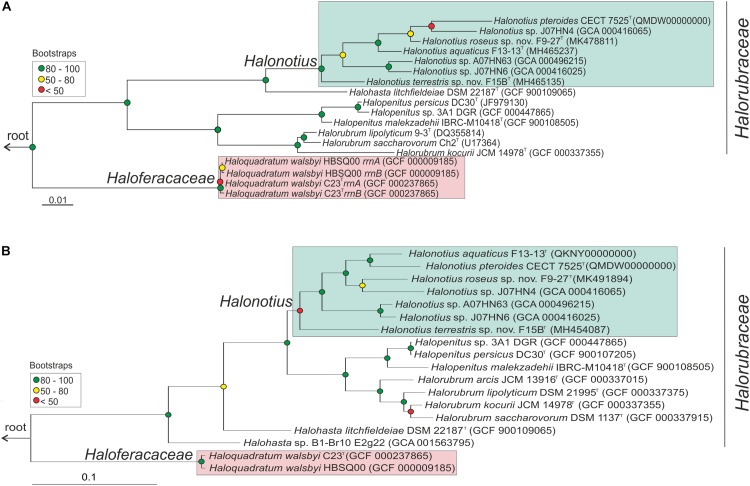
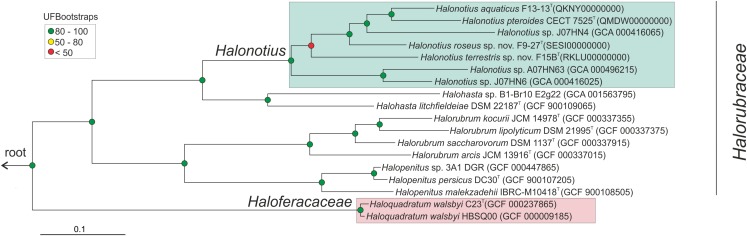
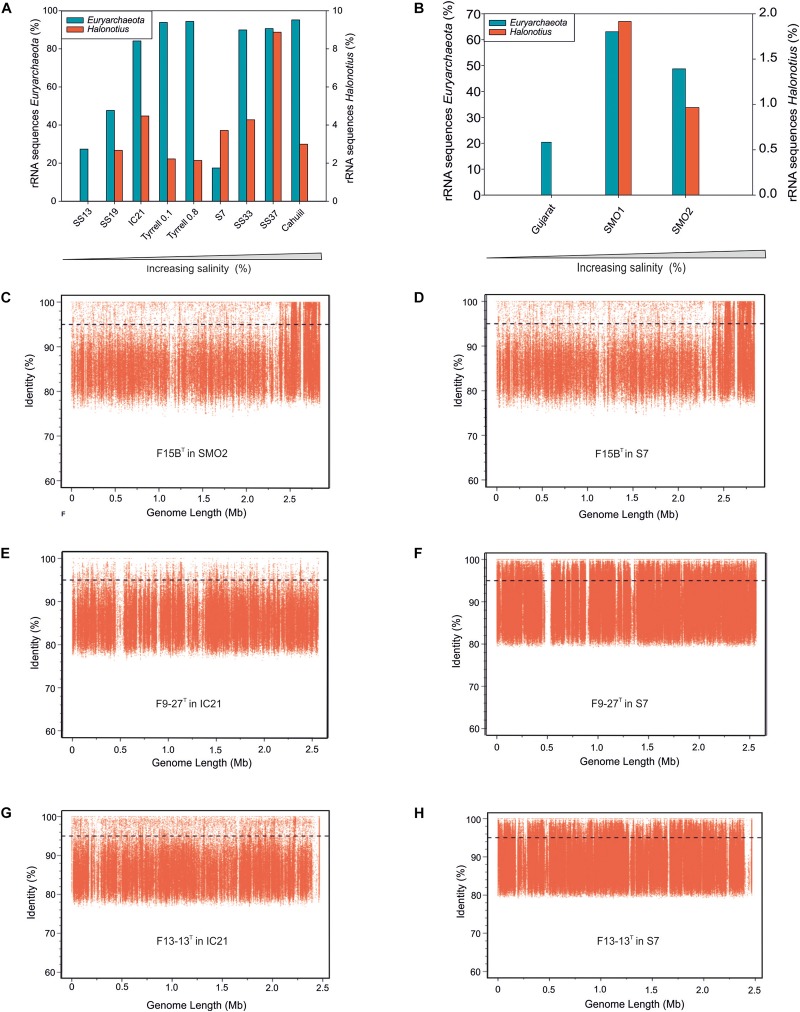
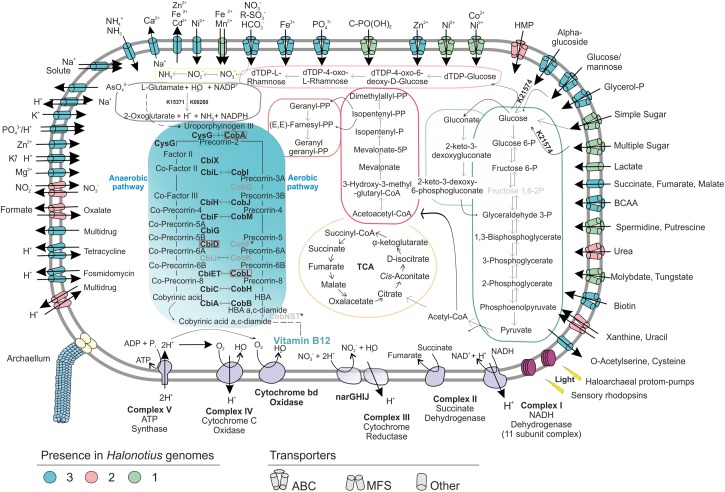
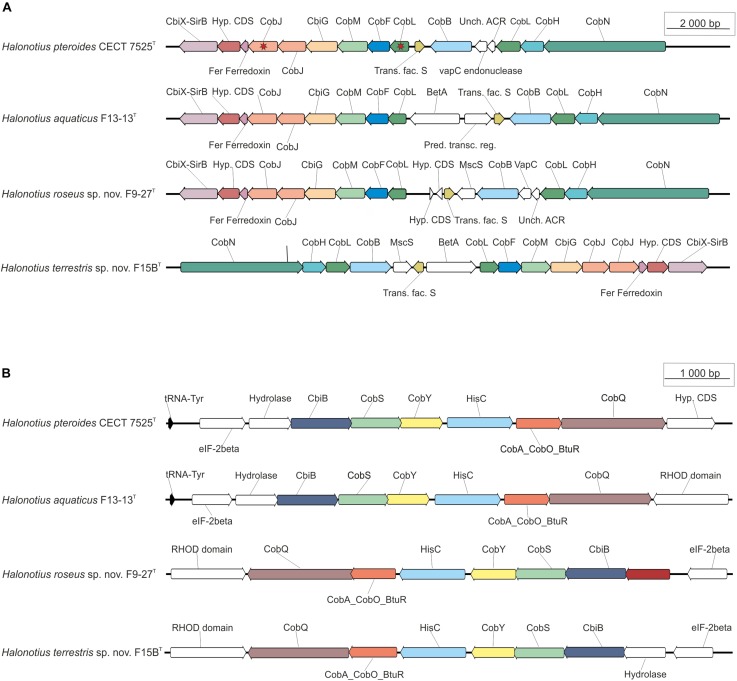
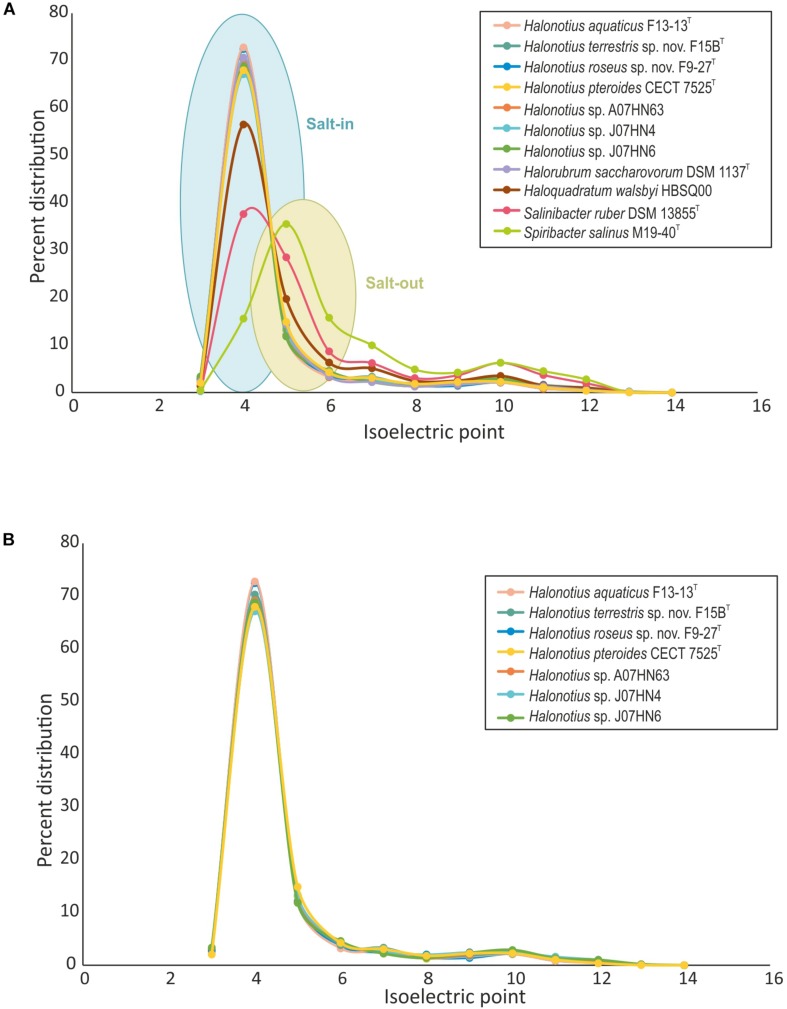
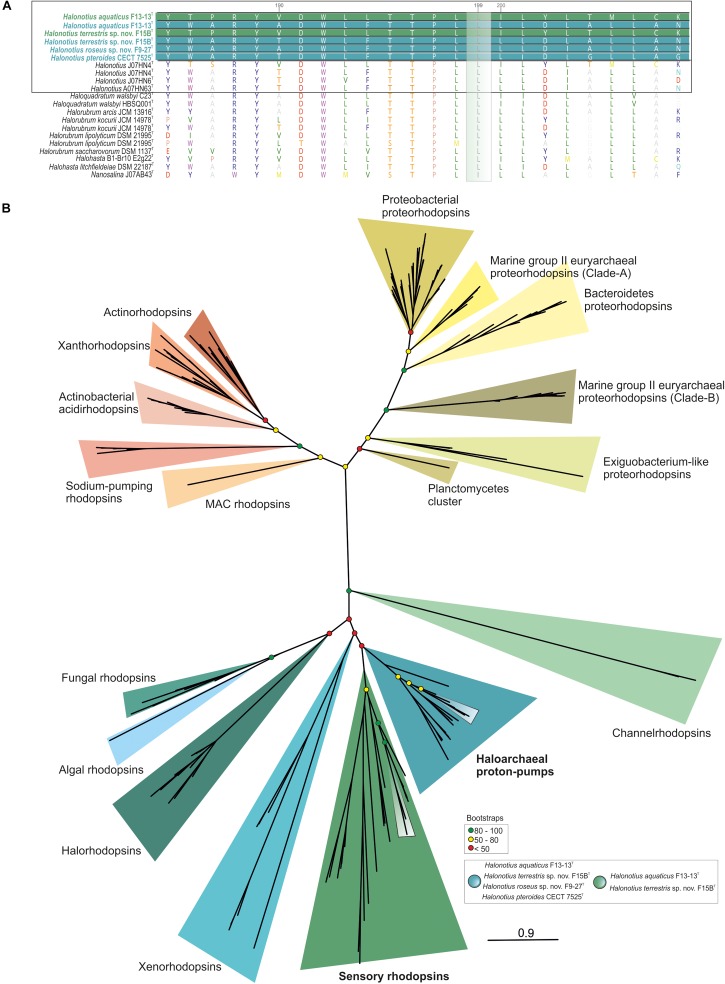
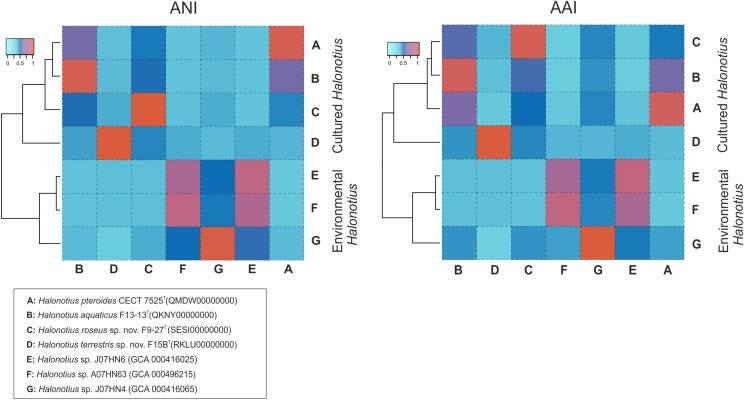
Hypersaline aquatic and terrestrial ecosystems display a cosmopolitan distribution. These environments teem with microbes and harbor a plethora of prokaryotic lineages that evaded ecological characterization due to the prior inability to cultivate them or to access their genomic information. In order to close the current knowledge gap, we performed two sampling and isolation campaigns in the saline soils of the Odiel Saltmarshes and the salterns of Isla Cristina (Huelva, Spain). From the isolated haloarchaeal strains subjected to high-throughput phylogenetic screening, two were chosen (F15BT and F9-27T) for physiological and genomic characterization due of their relatedness to the genus Halonotius. Comparative genomic analyses were carried out between the isolated strains and the genomes of previously described species Halonotius pteroides CECT 7525T, Halonotius aquaticus F13-13T and environmentaly recovered metagenome-assembled representatives of the genus Halonotius. The topology of the phylogenomic tree showed agreement with the phylogenetic ones based on 16S rRNA and rpoB' genes, and together with average amino acid and nucleotide identities suggested the two strains as novel species within the genus. We propose the names Halonotius terrestris sp. nov. (type strain F15BT = CECT 9688T = CCM 8954T) and Halonotius roseus sp. nov. (type strain F9-27T = CECT 9745T = CCM 8956T) for these strains. Comparative genomic analyses within the genus highlighted a typical salt-in signature, characterized by acidic proteomes with low isoelectric points, and indicated heterotrophic aerobic lifestyles. Genome-scale metabolic reconstructions revealed that the newly proposed species encode all the necessary enzymatic reactions involved in cobalamin (vitamin B12) biosynthesis. Based on the worldwide distribution of the genus and its abundance in hypersaline habitats we postulate that its members perform a critical function by being able to provide "expensive" commodities (i.e., vitamin B12) to the halophilic microbial communities at large.

Keywords: Halonotius; Halonotius roseus sp. nov.; Halonotius terrestris sp. nov.; comparative genomic analysis; haloarchaea; hypersaline environment.


Figures

FIGURE 1
FIGURE 1
Halonotius phylogenetic analysis. (A) Maximum-likelihood phylogenetic tree based on the 16S rRNA gene sequences. Bar, 0.01 substitutions per nucleotide position. (B) Maximum-likelihood phylogenetic tree based on amino acid sequences of the rpoB′ genes. Bar, 0.1 substitution per nucleotide position. Sequence accession numbers are shown in parentheses. Red circles highlight Bootstrap/UFBootstrap values lower than 50, the yellow ones between 50 and 80 and green color is used to depict values higher than 80. The trees were rooted using the DPANN representatives Candidatus Nanosalinarum J07AB56 and Candidatus Nanosalina J07AB43.
FIGURE 2
FIGURE 2
Halonotius phylogenomic tree. Maximum-likelihood phylogenomic tree based on the alignment of 257 shared orthologous genes. Bar, 0.1 substitution per nucleotide position. Sequence accession numbers are shown in parentheses. Red circles highlight Bootstrap/UFBootstrap values lower than 50, the yellow ones between 50 and 80 and green color is used to depict values higher than 80. The trees were rooted using the DPANN representatives Candidatus Nanosalinarum J07AB56 and Candidatus Nanosalina J07AB43.
FIGURE 3
FIGURE 3
Halonotius sequences abundance. (A,B) Percentage of rRNA sequences related to Euryarchaeota and Halonotius recovered from 12 shotgun metagenomes. The metagenomic datasets are ordered by salinity gradient. (C–H) Recruitment plots of Halonotius strains F15BT, F9-27T and Halonotius aquaticus F13-13T against different hypersaline habitats. In each panel the Y axis represents the identity percentage and X axis represents the genome length. A restrictive cut-off 95% of nucleotide identity in at least 30 bp of the metagenomic read was used. The black dashed line shows the threshold for presence of same species (95% identity). SS13, Metagenome from Santa Pola solar saltern (Alicante, Spain), 13% salinity (SRX328504); SS19, Metagenome from Santa Pola solar saltern (Alicante, Spain), 19% salinity (SRX090228); IC21, Metagenome from Isla Cristina solar saltern (Huelva, Spain), 21% salinity (SRX352042); Tyrrell 0.1, Metagenome from Lake Tyrrell (Victoria, Australia), 29% salinity (SRR5637210); Tyrrell 0.8, Metagenome from Lake Tyrrell (Victoria, Australia), 29% salinity (SRR5637211); S7, Metagenome from Fara Fund hypersaline meromictic lake, 30% salinity (SRR8921445); SS33, Metagenome from Santa Pola solar saltern (Alicante, Spain), 33% salinity (SRX347883); SS37, Metagenome from Santa Pola solar saltern (Alicante, Spain), 37% salinity (SRX090229); Cahuill, Metagenome from Cahuil lagoon (Chile), 34% salinity (SRX680116); Gujarat, Metagenome from Little Rann of Kutch hypersaline soil (Gujarat, India), (ERP005612); SMO1, Metagenome from Marismas del Odiel Salt Marshes hypersaline soil (Huelva, Spain), 24 mS/cm salinity (SRR5753725); SMO2, Metagenome from Marismas del Odiel Salt Marshes hypersaline soil (Huelva, Spain), 54 mS/cm salinity (SRR5753724).
FIGURE 4
FIGURE 4
Metabolic reconstruction of the isolated strains Halonotius terrestris sp. nov. F15BT, Halonotius roseus sp. nov. F9-27T and Halonotius aquaticus F13-13T. The turquoise panel depicts the simplified metabolic pathway of vitamin B12 biosynthesis; the gene names highlighted in boldface were present in the genomes, while the ones in gray are inferred to be absent in archaea. Horizontal arrows indicate homology between aerobic and anaerobic pathway enzymes. The discontinuous lines correspond to complete pathways not represented in the figure. The dark green box highlights glycolysis (Embden–Meyerhof–Parnas), while the light green one shows the Entner–Doudoroff pathway modified for haloarchaea. The orange depicts the tricarboxylic acid cycle (TCA); pink color corresponds to isoprenoid biosynthesis: C5 isoprenoid (dark) and C10–C20 isoprenoid (light). The light violet box corresponds to dTDP-L-rhamnose biosynthesis; the yellow color shows the assimilatory nitrate reduction pathway; dark purple is used for the L-glutamate degradation by glutamate dehydrogenase (GdhA). Alpha-amylase enzyme for glucose degradation is also represented by its KO identifier. Transparency was used to show the inferred components of the complex III of electron transport chain. Red boxes are used for genes not present in the studied genomes. BCAA, branched-chain amino acid; HMP, hydroxymethylpyrimidine; TCA, tricarboxylic acid cycle.
FIGURE 5
FIGURE 5
Halonotius cobalamin synthesis gene clusters involved in cobalamin synthesis. The figure highlights the co-occurrence of cobalamin synthesis genes and their conserved order in the analyzed Halonotius genomes (n = 4). (A) Represents the genes from the first stage of the pathway, from uroporphyrinogen III to a,c-diamine. (B) Represents the genes from the second stage of the pathway, from a,c-diamine to vitamin B12. The red star marks genes that are present in two copies. The genes depicted in white color were found not to be conserved in the gene cluster. The scale bar indicates gene lengths (in bp).
FIGURE 6
FIGURE 6
Comparison of isoelectric profiles of Halonotius proteomes with those of other prokaryotic species. (A) Comparison of isoelectric point of predicted proteins for Halonotius and other prokaryotic species, computed for each translated genome and shown as a percentage of distribution. (B) Comparison of isoelectric point of predicted proteins between proteomes of cultured Halonotius genomes and environmental Halonotius MAGs, shown as a percentage of distribution.
FIGURE 7
FIGURE 7
Halonotius rhodopsin tree. (A) Alignment comparison of rhodopsin protein sequence from Halonotius and other haloarchaea. Sequence accession numbers are shown in parentheses. Cultured Halonotius sequences are highlighted in boldface; blue corresponds to haloarchaeal proton-pump rhodopsins, while green highlights the sensory ones. The green box shows the position 199 of the rhodopsin alignment. The leucine (L) variant absorbs maximally in the green spectrum. (B) Maximum-likelihood phylogenetic tree constructed using 220 rhodopsins sequences. Boxes were used to highlight rhodopsin sequences belonging to Halonotius (see box at bottom right side of the figure). Bootstrap values on nodes are indicated by colored circles. Red circles show values lower than 50, the yellow ones between 50 and 80; green color is used to depict values higher than 80.
FIGURE 8
FIGURE 8
Amino acid identities and average nucleotide identities between Halonotius genomes. Hierarchical clustering relationships between cultured Halonotius genomes and environmental Halonotius MAGs. Amino acid identities (AAI) and average nucleotide identities (ANI) are represented by heat maps, where similarity values are represented by the color key histograms on the upper panels. Strains and sequence accession numbers are shown in the box at the bottom of the figure.

Similar articles

Cited by

References

    1. Altschul S. F., Gish W., Miller W., Myers E. W., Lipman D. J. (1990). Basic local alignment search tool. J. Mol. Biol. 215 403–410. 10.1016/S0022-2836(05)80360-2 - DOI - PubMed
    1. Amoozegar M. A., Siroosi M., Atashgahi S., Smidt H., Ventosa A. (2017). Systematics of haloarchaea and biotechnological potential of their hydrolytic enzymes. Microbiology 163 623–645. 10.1099/mic.0.000463 - DOI - PubMed
    1. Anderson I., Scheuner C., Göker M., Mavromatis K., Hooper S. D., Porat I., et al. (2011). Novel insights into the diversity of catabolic metabolism from ten haloarchaeal genomes. PLoS One 6:e20237. 10.1371/journal.pone.0020237 - DOI - PMC - PubMed
    1. Arahal D. R., Dewhirst F. E., Paster B. J., Volcani B. E., Ventosa A. (1996). Phylogenetic analyses of some extremely halophilic archaea isolated from Dead Sea water, determined on the basis of their 16S rRNA sequences. Appl. Environ. Microbiol. 62 3779–3786. - PMC - PubMed
    1. Auch A. F., Klenk H.-P., Göker M. (2010). Standard operating procedure for calculating genome-to-genome distances based on high-scoring segment pairs. Stand. Genomic Sci. 2 142–148. 10.4056/sigs.541628 - DOI - PMC - PubMed

LinkOut - more resources