

Sponges and Their Microbiomes Show Similar Community Metrics Across Impacted and Well-Preserved Reefs
- PMID: 31507568
- PMCID: PMC6713927
- DOI: 10.3389/fmicb.2019.01961
Sponges and Their Microbiomes Show Similar Community Metrics Across Impacted and Well-Preserved Reefs
Abstract
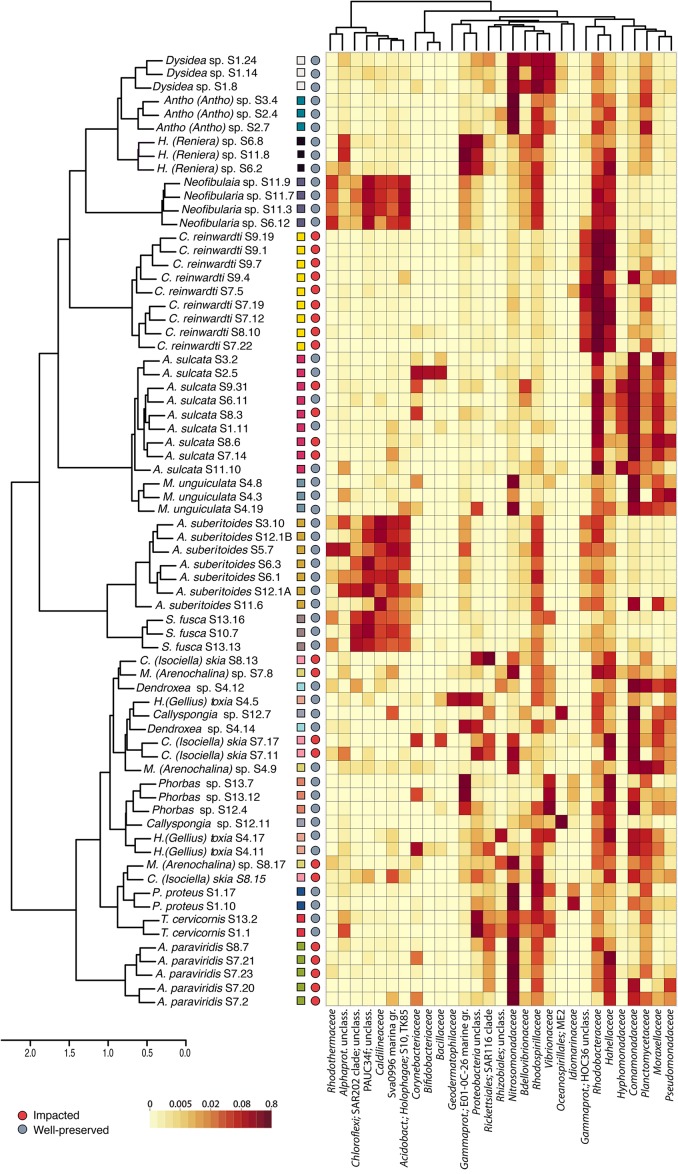
Sponge diversity has been reported to decrease from well-preserved to polluted environments, but whether diversity and intra-species variation of their associated microbiomes also change as function of environmental quality remains unknown. Our study aimed to assess whether microbiome composition and structure are related to the proliferation of some sponges and not others under degraded conditions. We characterized the most frequent sponges and their associated bacteria in two close areas (impacted and well-preserved) of Nha Trang Bay (Indo-Pacific). Sponge assemblages were richer and more diverse in the well-preserved reefs, but more abundant (individuals/m. transect) in the impacted environments, where two species (Clathria reinwardti and Amphimedon paraviridis) dominated. Sponge microbiomes from the polluted zones had, in general, lower bacterial diversity and core size and consequently, higher intra-species dispersion than microbiomes of sponges from the well-preserved environments. Microbial communities reflect the reduction of diversity and richness shown by their host sponges. In this sense, sponges with less complex and more variable microbiomes proliferate under degraded environmental conditions, following the ecological paradigm that negatively correlates community diversity and environmental degradation. Thereby, the diversity and structure of sponge microbiomes might indirectly determine the presence and proliferation of sponge species in certain habitats.
Keywords: contrasting environments; diversity; ecology; eutrophication; microbiomes; resilience; sponges.
Figures


Similar articles
-
Multipartner Symbiosis across Biological Domains: Looking at the Eukaryotic Associations from a Microbial Perspective.mSystems. 2019 Jun 25;4(4):e00148-19. doi: 10.1128/mSystems.00148-19. mSystems. 2019. PMID: 31239394 Free PMC article.
-
Evidence of habitat specificity in sponge microbiomes from Antarctica.Environ Microbiome. 2024 Dec 4;19(1):100. doi: 10.1186/s40793-024-00648-4. Environ Microbiome. 2024. PMID: 39633476 Free PMC article.
-
Effects of Seasonal Anoxia on the Microbial Community Structure in Demosponges in a Marine Lake in Lough Hyne, Ireland.mSphere. 2021 Feb 3;6(1):e00991-20. doi: 10.1128/mSphere.00991-20. mSphere. 2021. PMID: 33536324 Free PMC article.
-
Comparative Metagenomic Analysis of Biosynthetic Diversity across Sponge Microbiomes Highlights Metabolic Novelty, Conservation, and Diversification.mSystems. 2022 Aug 30;7(4):e0035722. doi: 10.1128/msystems.00357-22. Epub 2022 Jul 18. mSystems. 2022. PMID: 35862823 Free PMC article. Review.
-
Interocean patterns in shallow water sponge assemblage structure and function.Biol Rev Camb Philos Soc. 2020 Dec;95(6):1720-1758. doi: 10.1111/brv.12637. Epub 2020 Aug 19. Biol Rev Camb Philos Soc. 2020. PMID: 32812691 Review.
Cited by
-
Depth effect on the prokaryotic community assemblage associated with sponges from different rocky reefs.PeerJ. 2022 Apr 6;10:e13133. doi: 10.7717/peerj.13133. eCollection 2022. PeerJ. 2022. PMID: 35411254 Free PMC article.
-
Profiling Prokaryotic Communities and Aaptamines of Sponge Aaptos suberitoides from Tulamben, Bali.Mar Biotechnol (NY). 2023 Dec;25(6):1158-1175. doi: 10.1007/s10126-023-10268-7. Epub 2023 Nov 27. Mar Biotechnol (NY). 2023. PMID: 38008858 Free PMC article.
-
Assessing the Diversity and Biomedical Potential of Microbes Associated With the Neptune's Cup Sponge, Cliona patera.Front Microbiol. 2021 Jun 29;12:631445. doi: 10.3389/fmicb.2021.631445. eCollection 2021. Front Microbiol. 2021. PMID: 34267732 Free PMC article.
-
Defining and quantifying the core microbiome: Challenges and prospects.Proc Natl Acad Sci U S A. 2021 Dec 21;118(51):e2104429118. doi: 10.1073/pnas.2104429118. Proc Natl Acad Sci U S A. 2021. PMID: 34862327 Free PMC article. Review.
-
Metallic trace elements in marine sponges living in a semi-enclosed tropical lagoon.Biometals. 2024 Feb;37(1):157-169. doi: 10.1007/s10534-023-00536-3. Epub 2023 Sep 19. Biometals. 2024. PMID: 37725248
References
-
- Anderson M. J. (2001). A new method for non-parametric multivariate analysis of variance. Austral Ecol. 26 32–46. 10.1111/j.1442-9993.2001.01070.pp.x - DOI
LinkOut - more resources
Full Text Sources
Research Materials