

Leukocyte Dynamics Reveal a Persistent Myeloid Dominance in Giant Cell Arteritis and Polymyalgia Rheumatica
- PMID: 31507597
- PMCID: PMC6714037
- DOI: 10.3389/fimmu.2019.01981
Leukocyte Dynamics Reveal a Persistent Myeloid Dominance in Giant Cell Arteritis and Polymyalgia Rheumatica
Abstract
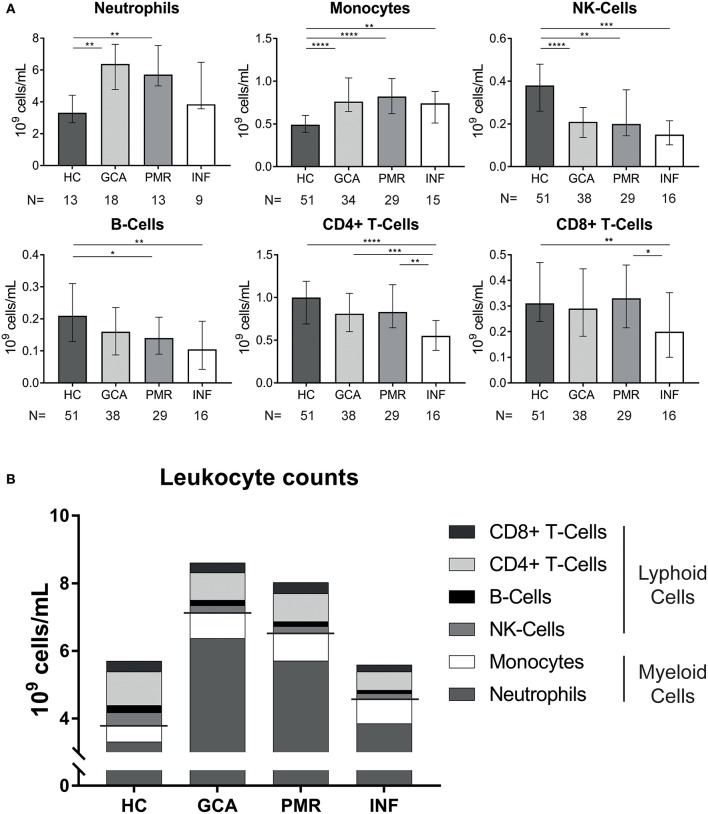
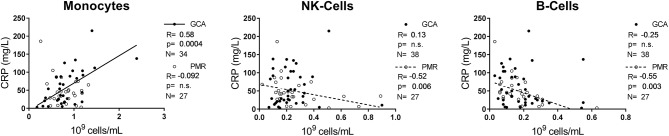
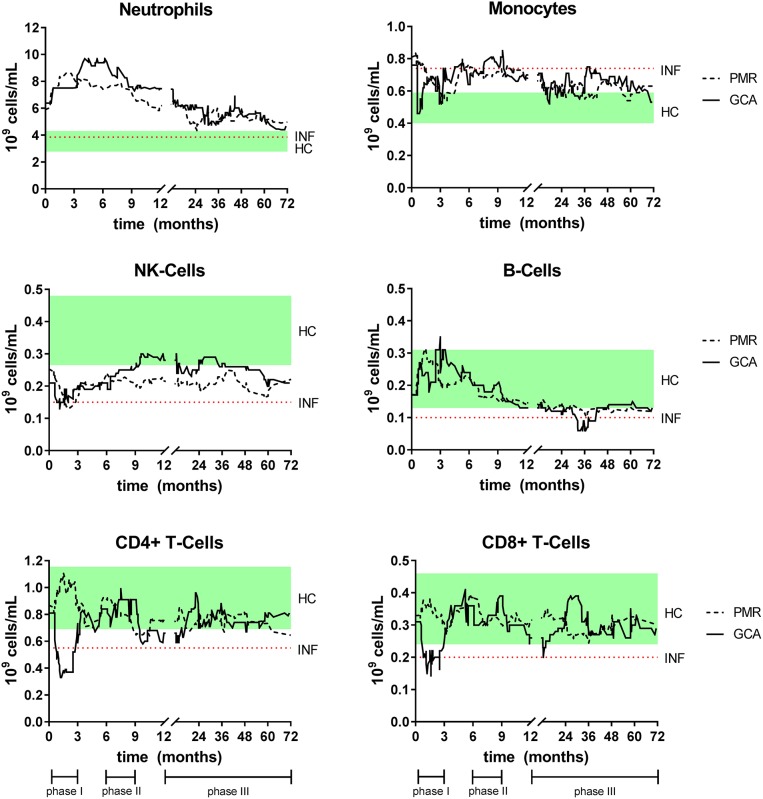
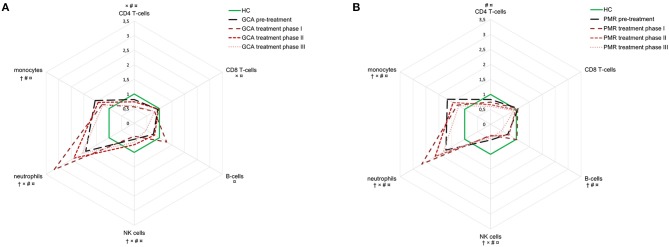
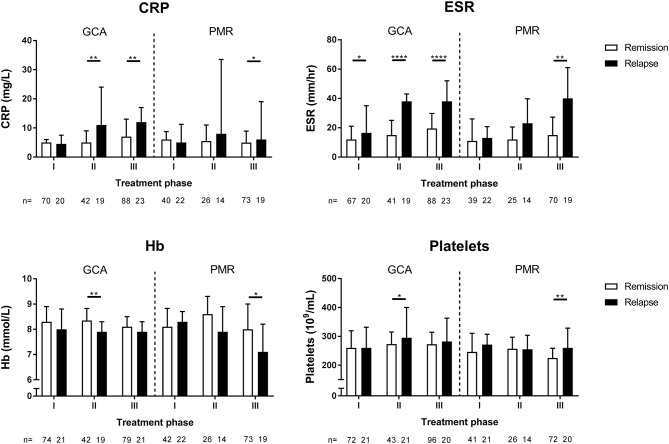
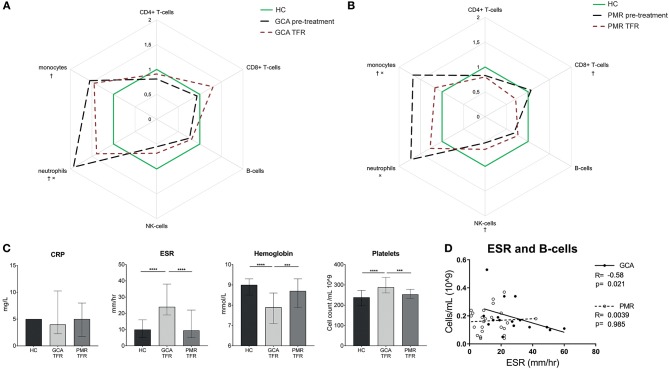
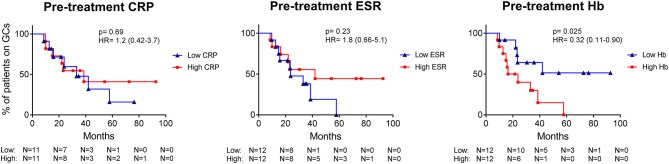
Giant cell arteritis (GCA) and polymyalgia rheumatica (PMR) are inflammatory diseases requiring long-term glucocorticoid treatment. Limited data on dynamics in leukocyte counts before, during and after treatment are available. Leukocyte counts were measured, as cellular markers of inflammation, at fixed time points in our prospectively studied cohort of pre-treatment glucocorticoid-naive GCA (N = 42) and PMR (N = 31) patients. Values were compared with age-matched healthy controls (HCs; N = 51) and infection controls (N = 16). We report that before start of treatment monocyte and neutrophil counts were higher in GCA and PMR patients than in HCs, while NK- and B-cell counts were lower. C-reactive protein (CRP) levels correlated positively with monocyte counts in GCA, and negatively with B-cell and NK-cell counts in PMR. During glucocorticoid treatment, myeloid subsets remained elevated whereas lymphoid subsets tended to fluctuate. Interestingly, erythrocyte sedimentation rate (ESR) outperformed CRP as marker for relapses in GCA. We defined stable treatment-free remission groups in both GCA and PMR. GCA patients in treatment-free remission still demonstrated elevated monocytes, neutrophils, ESR, and platelets. PMR patients in treatment-free remission had normalized levels of inflammation markers, but did have elevated monocytes, lowered CD8+ T-cell counts and lowered NK-cell counts. Finally, we showed that low hemoglobin level was predictive for long-term GC treatment in PMR. Overall, leukocyte composition shifts toward the myeloid lineage in GCA and PMR. This myeloid profile, likely induced by effects of inflammation on hematopoietic stem cell differentiation, persisted during glucocorticoid treatment. Surprisingly, the myeloid profile was retained in treatment-free remission, which may reflect ongoing subclinical inflammation.
Keywords: giant cell arteritis; glucocorticoids; longitudinal cohort study; polymyalgia rheumatica; relapses; treatment-free remission; vasculitis.
Figures
Similar articles
-
Aberrant phenotype of circulating antigen presenting cells in giant cell arteritis and polymyalgia rheumatica.Front Immunol. 2023 Aug 2;14:1201575. doi: 10.3389/fimmu.2023.1201575. eCollection 2023. Front Immunol. 2023. PMID: 37600779 Free PMC article.
-
Predictors for treatment success and expression of glucocorticoid receptor in giant cell arteritis and polymyalgia rheumatica.J Rheumatol. 2009 Oct;36(10):2269-76. doi: 10.3899/jrheum.090075. Epub 2009 Aug 14. J Rheumatol. 2009. PMID: 19684157
-
Polymyalgia rheumatica shows metabolomic alterations that are further altered by glucocorticoid treatment: Identification of metabolic correlates of fatigue.J Autoimmun. 2024 Jul;147:103260. doi: 10.1016/j.jaut.2024.103260. Epub 2024 May 25. J Autoimmun. 2024. PMID: 38797046
-
Circulating CD8+ T cells in polymyalgia rheumatica and giant cell arteritis: a review.Semin Arthritis Rheum. 2001 Feb;30(4):257-71. doi: 10.1053/sarh.2001.9734. Semin Arthritis Rheum. 2001. PMID: 11182026 Review.
-
Polymyalgia rheumatica and giant cell arteritis in older patients: diagnosis and pharmacological management.Drugs Aging. 2011 Aug 1;28(8):651-66. doi: 10.2165/11592500-000000000-00000. Drugs Aging. 2011. PMID: 21812500 Review.
Cited by
-
Changes in the molecular profiles of large-vessel vasculitis treated with biological disease-modifying anti-rheumatic drugs and Janus kinase inhibitors.Front Immunol. 2023 May 1;14:1197342. doi: 10.3389/fimmu.2023.1197342. eCollection 2023. Front Immunol. 2023. PMID: 37197652 Free PMC article. Review.
-
From Active to Non-active Giant Cell Arteritis: Longitudinal Monitoring of Patients on Glucocorticoid Therapy in Combination With Leflunomide.Front Med (Lausanne). 2022 Jan 20;8:827095. doi: 10.3389/fmed.2021.827095. eCollection 2021. Front Med (Lausanne). 2022. PMID: 35127774 Free PMC article.
-
Immune complex-mediated neutrophil activation in patients with polymyalgia rheumatica.Rheumatology (Oxford). 2023 Aug 1;62(8):2880-2886. doi: 10.1093/rheumatology/keac722. Rheumatology (Oxford). 2023. PMID: 36562570 Free PMC article.
-
Elderly-onset rheumatoid arthritis vs. polymyalgia rheumatica: Differences in pathogenesis.Front Med (Lausanne). 2023 Jan 12;9:1083879. doi: 10.3389/fmed.2022.1083879. eCollection 2022. Front Med (Lausanne). 2023. PMID: 36714116 Free PMC article. Review.
-
Risk loci involved in giant cell arteritis susceptibility: a genome-wide association study.Lancet Rheumatol. 2024 Jun;6(6):e374-e383. doi: 10.1016/S2665-9913(24)00064-X. Epub 2024 May 8. Lancet Rheumatol. 2024. PMID: 38734017 Free PMC article.
References
Publication types
MeSH terms
Substances
LinkOut - more resources
Full Text Sources
Medical
Research Materials
Miscellaneous