. 2019 Aug 23:10:754.
doi: 10.3389/fgene.2019.00754. eCollection 2019.

The Cancer-Associated Genetic Variant Rs3903072 Modulates Immune Cells in the Tumor Microenvironment

Affiliations

The Cancer-Associated Genetic Variant Rs3903072 Modulates Immune Cells in the Tumor Microenvironment

Yi Zhang et al. Front Genet. .

Abstract

Genome-wide association studies (GWAS) have hitherto identified several germline variants associated with cancer susceptibility, but the molecular functions of these risk modulators remain largely uncharacterized. Recent studies have begun to uncover the regulatory potential of noncoding GWAS SNPs using epigenetic information in corresponding cancer cell types and matched normal tissues. However, this approach does not explore the potential effect of risk germline variants on other important cell types that constitute the microenvironment of tumor or its precursor. This paper presents evidence that the breast-cancer-associated variant rs3903072 may regulate the expression of CTSW in tumor-infiltrating lymphocytes. CTSW is a candidate tumor-suppressor gene, with expression highly specific to immune cells and also positively correlated with breast cancer patient survival. Integrative analyses suggest a putative causative variant in a GWAS-linked enhancer in lymphocytes that loops to the 3' end of CTSW through three-dimensional chromatin interaction. Our work thus poses the possibility that a cancer-associated genetic variant could regulate a gene not only in the cell of cancer origin but also in immune cells in the microenvironment, thereby modulating the immune surveillance by T lymphocytes and natural killer cells and affecting the clearing of early cancer initiating cells.

Keywords: GWAS; breast cancer; functional characterization; immune cells; noncoding variant; tumor microenvironment.


Figures

Figure 1
Figure 1
The breast cancer risk variant rs3903072 in the 11q13.1 region. (A) The top track shows UCSC genes, and the lower track shows the GWAS variants grouped by their reported traits into four categories ( Supplementary Table 1 ). The SNP rs3903072 shows a stronger association with breast cancer (p = 2 × 10–12) than the variant rs617791 (p = 7 × 10⁻⁶). (B) The eQTL results for rs3903072. A full list of eQTL genes is in Supplementary Table 3 . Left three bar plots show the significance of the contribution from rs3903072 genotype to the expression level of MUS81, CTSW, FIBP and EIF1AD. Positive values represent higher expression as the number of risk allele increases, and negative values represent the opposite trend. CTSW is the only eQTL gene with a significant suppression in the risk genotype group. This negative correlation between CTSW expression level and the genotype status is confirmed in the three independent datasets shown. The right bar plot shows the significance of the contribution from gene copy number to the expression level of each gene. Filled bar plots represent tumor, while transparent plots represent normal tissues; in this paper, we use the cyan color to indicate breast-related cancer or normal cells and the magenta color to indicate blood-related cells. The dotted lines in gray mark the significance threshold of p = 0.05.
Figure 2
Figure 2
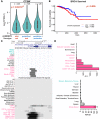
Genotype-dependent suppression and tissue specificity of CTSW expression. (A) The violin plot of CTSW expression levels in three genotype groups at rs3903072, using the TCGA ER+ breast cancer patient data. The p-value is for the coefficient of genotype in multivariate linear regression with adjustment for gene copy number. (B) Survival analysis of breast cancer patients based on CTSW expression levels. The p-value is from the log-rank test using the two groups separated by the median expression of CTSW. (C) The CTSW promoter chromatin accessibility in multiple cell lines from various tissue origins. The top ENCODE plot shows the DNase I hypersensitivity (DHS) uniform peaks in ENCODE tier 1 cell lines, along with the tier 2/3 cells in which CTSW promoter is open. The bottom plot shows the DHS signals for primary cells from Roadmap Epigenomics data. Cells with breast tissue origin are marked as cyan, and blood-related normal or cancer cells are marked as magenta. HMPC, hematopoietic multipotent progenitor cells; CMP CD34+, common myeloid progenitor cells CD34+. (D) Distribution of CTSW expression in cell lines and in tissues. The top figure shows data from BioGPS, displaying only 10 cell types with highest CTSW expression. The bottom figure shows data from GTEx, displaying only nine tissue types with highest CTSW expression and mammary tissue (ranked 13th).
Figure 3
Figure 3
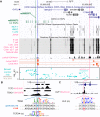
Potential regulatory mechanisms for CTSW. (A) The genomic region ranging from the GWAS SNP rs3903072 to CTSW is shown, including the gene track, the GWAS LD SNPs, epigenetics information, and 3D chromatin interaction. The chromatin accessibility data are shown for breast-related cells and blood cells from ENCODE and Roadmap Epigenomics Project. The H3K4me1 modification track and the SMC1 ChIA-PET significant interactions in the Jurkat cell line are from GSE119439 and GSE68978. The bottom Manhattan plot shows the SNPs associated with breast cancer with p < 10–5. Three SNPs are marked: the GWAS SNP rs3903072 and the GWAS-linked putative enhancer SNP in blue and the CTSW promoter SNP in magenta. (B, C) Zoomed-in views of the two potential regulatory SNPs. For the GWAS-linked putative enhancer SNP, TCF3 ChIP-seq data in Kasumi1 and TBX21 ChIP-seq data in GM12878 are shown. Two candidate TF motifs predicted to be affected by the SNP are also shown, where the protective allele is marked blue and the risk allele red. For the CTSW promoter SNP, KLF1 ChIP-seq profile in erythroid cells is plotted, along with a KLF family motif (rc, reverse complement).
Figure 4
Figure 4
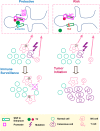
An illustration of our hypothesis. The putative molecular gene-regulation process is shown in the top boxed panels, and the tumor initiation process is illustrated in the two rows below. The left panel shows the process of cancer immune surveillance in people carrying the protective alleles at the GWAS SNP and the predicted functional enhancer SNP. In the top left box, the chromosome carrying the protective alleles produces an abundant CTSW mRNA level; as shown here, CTSW transcription could be elevated through a transcription activator binding the PRE1 SNP. Note that another scenario, not shown in the illustration, is also possible, where the protective allele could disrupt the binding motif of a transcription repressor. Going back to the cell view, the high level of CTSW expression in NK cells or T cells may enhance their cytotoxicity and facilitate their ability to detect and eliminate abnormal cells, such as cancerous mammary epithelial cells that just acquired some oncogenic mutations. This high efficiency of immune surveillance would thus reduce the risk of developing breast cancer. By contrast, the right panel shows the NK/T cells with suppressed CTSW expression associated with the risk alleles, resulting in reduced cytotoxic activities and suppressed immune surveillance efficiency, thereby increasing the risk of developing breast cancer.

Similar articles

Cited by

References

    1. Aponte J. L., Chiano M. N., Yerges-Armstrong L. M., Hinds D. A., Tian C., Gupta A., et al. (2018). Assessment of rosacea symptom severity by genome-wide association study and expression analysis highlights immuno-inflammatory and skin pigmentation genes. Hum. Mol. Genet. 27 (15), 2762–2772. 10.1093/hmg/ddy184 - DOI - PMC - PubMed
    1. Barretina J., Caponigro G., Stransky N., Venkatesan K., Margolin A. A., Kim S., et al. (2012). The Cancer Cell Line Encyclopedia enables predictive modelling of anticancer drug sensitivity. Nature 483, 603. 10.1038/nature11003 - DOI - PMC - PubMed
    1. Barrett T., Wilhite S. E., Ledoux P., Evangelista C., Kim I. F., Tomashevsky M., et al. (2013). NCBI GEO: archive for functional genomics data sets—update. Nucleic Acids Res. 41, D991–D995. 10.1093/nar/gks1193 - DOI - PMC - PubMed
    1. Bernstein B. E., Stamatoyannopoulos J. A., Costello J. F., Ren B., Milosavljevic A., Meissner A., et al. (2010). The NIH Roadmap Epigenomics Mapping Consortium. Nat. Biotechnol. 28 (10), 1045–1048. 10.1038/nbt1010-1045 - DOI - PMC - PubMed
    1. Carithers L. J., Ardlie K., Barcus M., Branton P. A., Britton A., Buia S. A., et al. (2015). A novel approach to high-quality postmortem tissue procurement: the GTEx Project. Biopreserv. Biobanking 13 (5), 311–319. 10.1089/bio.2015.0032 - DOI - PMC - PubMed

LinkOut - more resources