

Evaluation of Rapid Library Preparation Protocols for Whole Genome Sequencing Based Outbreak Investigation
- PMID: 31508405
- PMCID: PMC6719548
- DOI: 10.3389/fpubh.2019.00241
Evaluation of Rapid Library Preparation Protocols for Whole Genome Sequencing Based Outbreak Investigation
Abstract
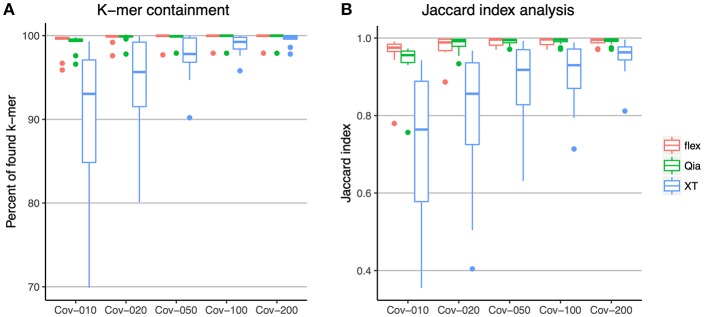
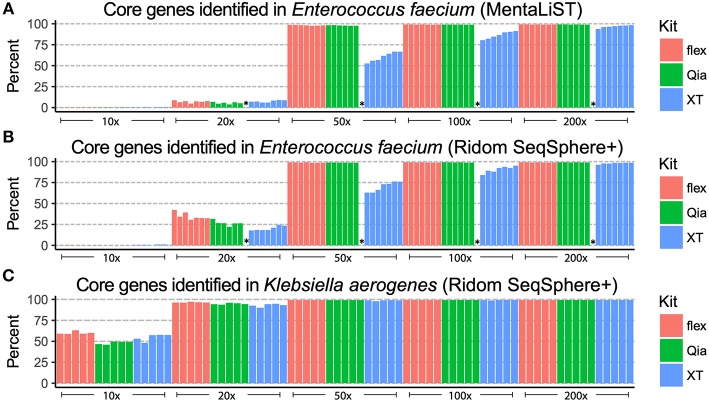
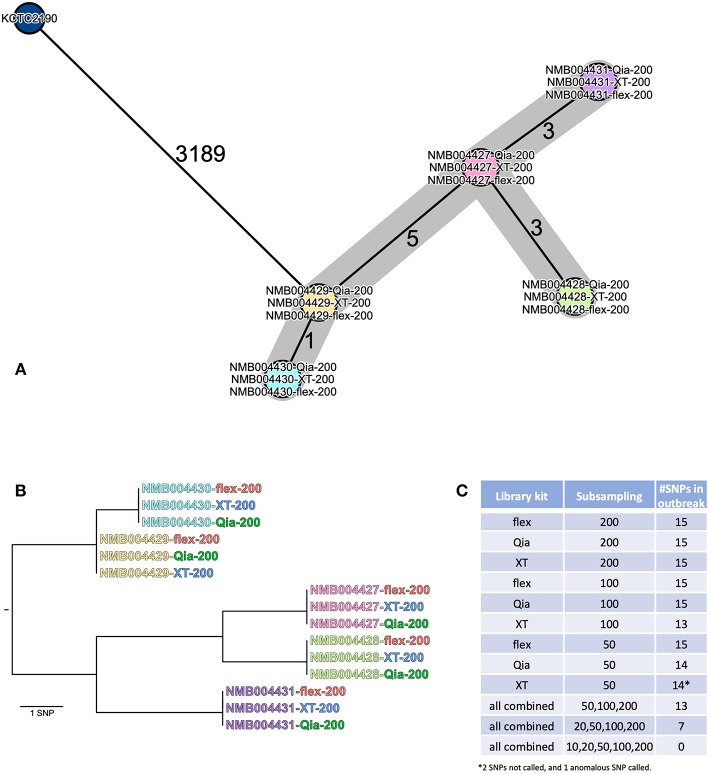
Whole genome sequencing (WGS) has become the new gold standard for bacterial outbreak investigation, due to the high resolution available for typing. While sequencing is currently predominantly performed on Illumina devices, the preceding library preparation can be performed using various protocols. Enzymatic fragmentation library preparation protocols are fast, have minimal hands-on time, and work with small quantities of DNA. The aim of our study was to compare three library preparation protocols for molecular typing: Nextera XT (Illumina); Nextera Flex (Illumina); and QIAseq FX (Qiagen). We selected 12 ATCC strains from human Gram-positive and Gram-negative pathogens with %G+C-content ranging from 27% (Fusobacterium nucleatum) to 73% (Micrococcus luteus), each having a high quality complete genome assembly available, to allow in-depth analysis of the resulting Illumina sequence data quality. Additionally, we selected isolates from previously analyzed cases of vancomycin-resistant Enterococcus faecium (VRE) (n = 7) and a local outbreak of Klebsiella aerogenes (n = 5). The number of protocol steps and time required were compared, in order to test the suitability for routine laboratory work. Data analyses were performed with standard tools commonly used in outbreak situations: Ridom SeqSphere+ for cgMLST; CLC genomics workbench for SNP analysis; and open source programs. Nextera Flex and QIAseq FX were found to be less sensitive than Nextera XT to variable %G+C-content, resulting in an almost uniform distribution of read-depth. Therefore, low coverage regions are reduced to a minimum resulting in a more complete representation of the genome. Thus, with these two protocols, more alleles were detected in the cgMLST analysis, producing a higher resolution of closely related isolates. Furthermore, they result in a more complete representation of accessory genes. In particular, the high data quality and relative simplicity of the workflow of Nextera Flex stood out in this comparison. This thorough comparison within an ISO/IEC 17025 accredited environment will be of interest to those aiming to optimize their clinical microbiological genome sequencing.
Keywords: Illumina; NGS; bacteria; comparison; library; next generation sequencing; prokaryotes; whole genome sequencing.
Figures

Similar articles
-
Sequencing of Enteric Bacteria: Library Preparation Procedure Matters for Accurate Identification and Characterization.Foodborne Pathog Dis. 2022 Aug;19(8):569-578. doi: 10.1089/fpd.2022.0017. Epub 2022 Jul 21. Foodborne Pathog Dis. 2022. PMID: 35861967
-
Hackflex: low-cost, high-throughput, Illumina Nextera Flex library construction.Microb Genom. 2022 Jan;8(1):000744. doi: 10.1099/mgen.0.000744. Microb Genom. 2022. PMID: 35014949 Free PMC article.
-
Optimization of enzymatic fragmentation is crucial to maximize genome coverage: a comparison of library preparation methods for Illumina sequencing.BMC Genomics. 2022 Feb 1;23(1):92. doi: 10.1186/s12864-022-08316-y. BMC Genomics. 2022. PMID: 35105301 Free PMC article.
-
Application of next generation sequencing in clinical microbiology and infection prevention.J Biotechnol. 2017 Feb 10;243:16-24. doi: 10.1016/j.jbiotec.2016.12.022. Epub 2016 Dec 29. J Biotechnol. 2017. PMID: 28042011 Review.
-
Development and Implementation of Whole Genome Sequencing-Based Typing Schemes for Clostridioides difficile.Front Public Health. 2019 Oct 24;7:309. doi: 10.3389/fpubh.2019.00309. eCollection 2019. Front Public Health. 2019. PMID: 31709221 Free PMC article. Review.
Cited by
-
Evaluating whole-genome sequencing quality metrics for enteric pathogen outbreaks.PeerJ. 2021 Nov 25;9:e12446. doi: 10.7717/peerj.12446. eCollection 2021. PeerJ. 2021. PMID: 34900416 Free PMC article.
-
Rapid inference of antibiotic susceptibility phenotype of uropathogens using metagenomic sequencing with neighbor typing.Microbiol Spectr. 2025 Jan 7;13(1):e0136624. doi: 10.1128/spectrum.01366-24. Epub 2024 Nov 29. Microbiol Spectr. 2025. PMID: 39611823 Free PMC article.
-
Comparison of SARS-CoV-2 sequencing using the ONT GridION and the Illumina MiSeq.BMC Genomics. 2022 Apr 22;23(1):319. doi: 10.1186/s12864-022-08541-5. BMC Genomics. 2022. PMID: 35459088 Free PMC article.
-
Evaluation of DNA extraction kits for long-read shotgun metagenomics using Oxford Nanopore sequencing for rapid taxonomic and antimicrobial resistance detection.Sci Rep. 2024 Nov 27;14(1):29531. doi: 10.1038/s41598-024-80660-3. Sci Rep. 2024. PMID: 39604411 Free PMC article.
-
Longitudinal Analysis of Canine Oral Microbiome Using Whole Genome Sequencing in Aging Companion Dogs.Animals (Basel). 2023 Dec 14;13(24):3846. doi: 10.3390/ani13243846. Animals (Basel). 2023. PMID: 38136883 Free PMC article.
References
LinkOut - more resources
Full Text Sources