. 2019 Aug 22;4(10):14301-14306.
doi: 10.1021/acsomega.9b01976. eCollection 2019 Sep 3.

Media Characterization under Scattering Conditions by Nanophotonics Iterative Multiplane Spectroscopy Measurements

Affiliations

Media Characterization under Scattering Conditions by Nanophotonics Iterative Multiplane Spectroscopy Measurements

Inbar Yariv et al. ACS Omega. .

Abstract

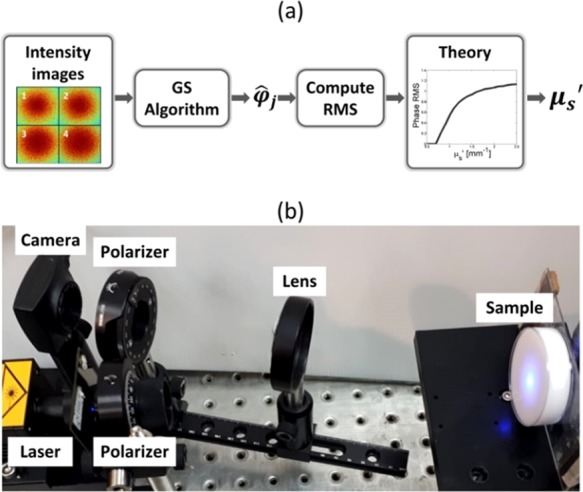
Characterizing materials is preferably done by multiple wavelengths. In opaque materials, the scattering poses a challenge due to the additional complexity to the spectroscopic measurements. We have previously demonstrated an iterative multiplane method for characterizing materials using the reflection from turbid media. Initial studies were performed in the red wavelength regime (632.8 nm) which is optimal for biomedical applications. However, in order to differentiate between materials, it is better to use multiple wavelengths, as spectroscopy may detect the material fingerprint. In this paper, our iterative multiplane optical property extraction (IMOPE) technique is presented in the blue regime (473 nm). Agar-based solid phantom measurements were conducted and compared to our theoretical model. Compatibility between experiments in the red and blue wavelengths shows the robustness of our technique.


Conflict of interest statement

The authors declare no competing financial interest.

Figures

Figure 1
Figure 1
Reflection-based IMOPE. (a) Schematic description of the IMOPE algorithm for extracting μs′. After running the multiplane GS algorithm as described elsewhere, the estimated phase φ̂j is retrieved. The RMS is computed and compared to the theory to produce the estimated μs′. (b) Experimental setup in the blue regime for recording light intensity images. The camera records images at multiple planes with equal intervals between them (dz). The light source is a DPSS laser with a wavelength of λ = 473 nm, and the focal length of the lens is 75 mm; polarizers were added for optical clearing purposes. The solid phantoms were set on a three-axis micrometer plates and can be adjusted in the xyz directions.
Figure 2
Figure 2
Calculated reduced scattering coefficient for different IL concentrations in the blue regime. For liquid phantoms (black line), μs′ was obtained by an extrapolation from Assadi et al. to the range of the IL concentrations we used. According to Cubeddu et al., there is a factor (smaller than 1) between liquid and solid phantoms. Here, a factor of 0.55 was used to receive the relation between μs′ and IL concentrations for solid phantoms (red line). The equations for both liquid and solid phantoms are located on the graph with proximity to their respective curves.
Figure 3
Figure 3
Phase RMS obtained theoretically (black) and experimentally (blue) for different μs′ values. The phase RMS was computed from two regimes: single-scattering regime (black dashed line and blue stars correspond to theory and experiment, respectively) and multiple-scattering regime (black straight line and blue circles correspond to theory and experiment, respectively). The theoretical results were received for the theoretical adjustments of λ = 473 nm, μa = 2 × 10⁻⁵ mm–1, and g = 0.85. For both regimes, the RMS obtained from experiments produced a standard deviation <0.014.
Figure 4
Figure 4
Reconstructed phase images obtained following the multiple-measurement GS algorithm for solid phantoms in the blue wavelength with (a) μs′ = 1.21 mm–1 and (b) μs′ = 1.44 mm–1. The border between the single- and multiple-scattering regimes is marked with the white circles. The phase was reconstructed using a distance between images of dz = 0.635 mm, a total propagation distance of 3.81 mm, and an image size of 3.35 mm × 3.35 mm.
Figure 5
Figure 5
Spectral comparison of the phase RMS for different μs′. The black line represents the theoretical phase RMS received with the respective parameters of the blue regime. Red and blue circles correspond to the experimental phase RMS obtained by using red and blue wavelengths for the multiple-scattering regimes. The standard deviation for both wavelengths was less than 0.017

Similar articles

Cited by

References

    1. Pelletier M. J.Analytical Applications of Raman Spectroscopy; Blackwell Science Oxford: 1999; Vol. 427.
    1. McCreery R. L.Raman Spectroscopy for Chemical Analysis; John Wiley & Sons: 2005; Vol. 225.
    1. Efremov E. V.; Ariese F.; Gooijer C. Achievements in resonance Raman spectroscopy: Review of a technique with a distinct analytical chemistry potential. Anal. Chim. Acta 2008, 606, 119–134. 10.1016/j.aca.2007.11.006. - DOI - PubMed
    1. Zhai L.; Adlhart C.; Spano F.; Innocenti Malini R.; Piątek A. K.; Li J.; Rossi R. M. Prediction of Steam Burns Severity using Raman Spectroscopy on ex vivo Porcine Skin. Sci. Rep. 2018, 8, 6946.10.1038/s41598-018-24647-x. - DOI - PMC - PubMed
    1. Ferreira Lima A. M.; Daniel C. R.; Navarro R. S.; Bodanese B.; Pasqualucci C. A.; Tavares Pacheco M. T.; Zângaro R. A.; Silveira L. Jr. Discrimination of non-melanoma skin cancer and keratosis from normal skin tissue in vivo and ex vivo by Raman spectroscopy. Vib. Spectrosc. 2019, 100, 131–141. 10.1016/j.vibspec.2018.11.009. - DOI

LinkOut - more resources