

The relationship between body mass index and preeclampsia: A systematic review and meta-analysis
- PMID: 31508571
- PMCID: PMC6718883
- DOI: 10.18502/ijrm.v17i7.4857
The relationship between body mass index and preeclampsia: A systematic review and meta-analysis
Abstract
Background: One of the causes of maternal and fetal mortality and morbidity is pregnancy-induced hypertension, the most common form of which is preeclampsia that causes many complications for mother and fetus.
Objective: The aim of this systematic review and meta-analysis was to determine the relationship between body mass index (BMI) and preeclampsia in Iran.
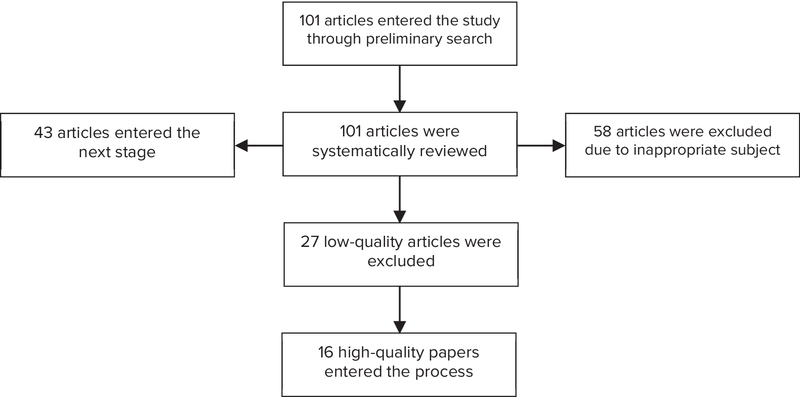
Materials and methods: Using valid keywords in the SID database, PubMed, Scopus, data obtained from all the articles, which were reviewed in Iran between 2000 and 2016, were combined using the meta-analysis method (random-effects model) and analyzed using STATA version 11.1.
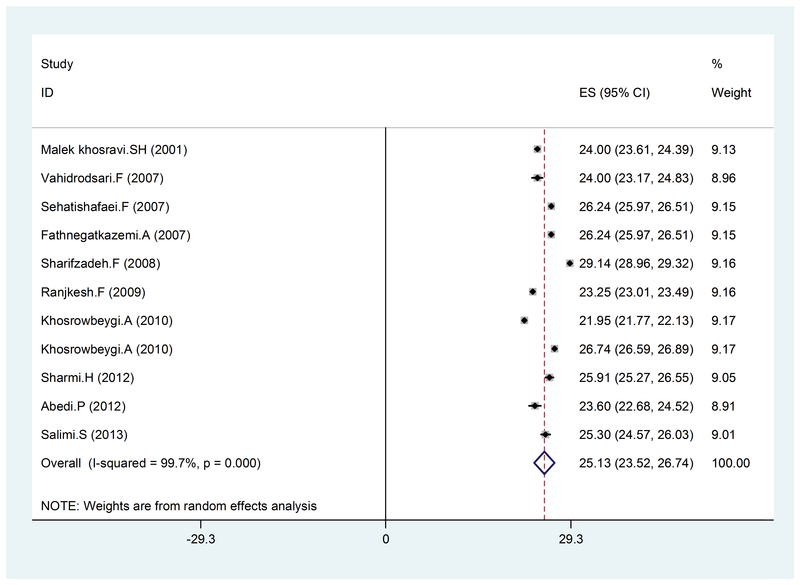
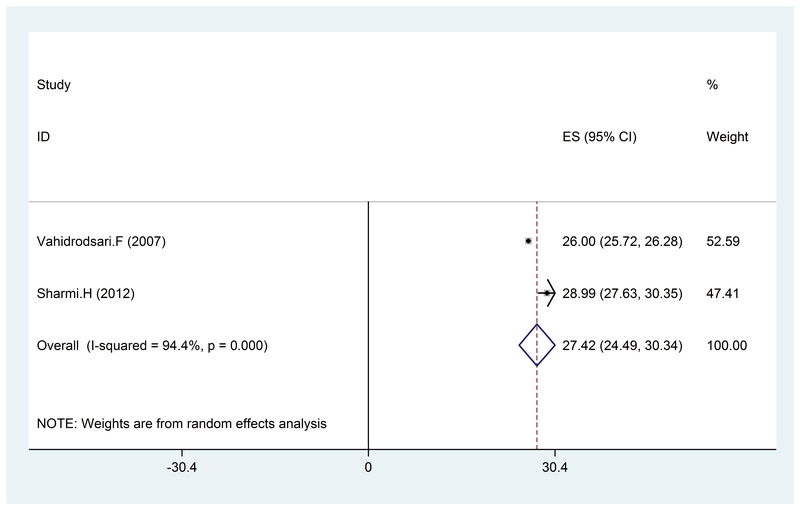
Results: A total number of 5,946 samples were enrolled in 16 studies with the mean BMI values of 25.13, 27.42, and 26.33 kg /m in the healthy, mild, and severe preeclamptic groups, respectively.
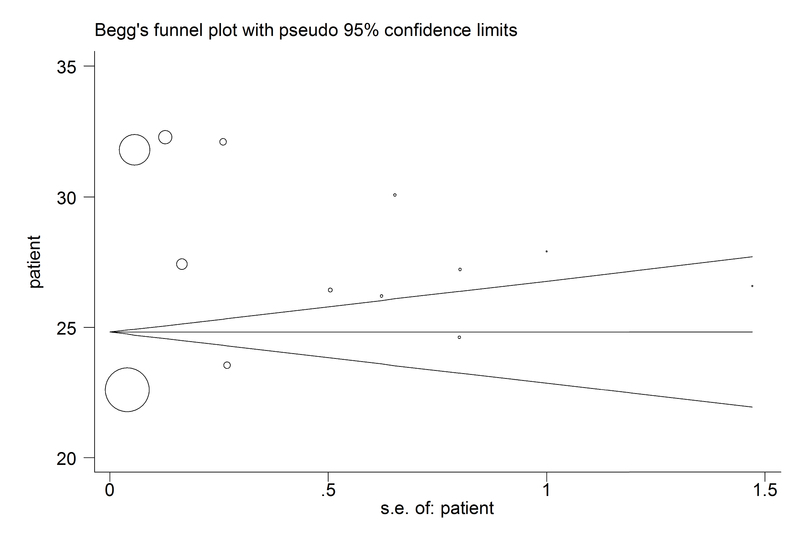
Conclusion: The results of this study revealed that there is a significant relationship between BMI and the risk of preeclampsia, so it can be said that BMI may be one of the ways to diagnose preeclampsia.
Keywords: Body mass index; Iran; Meta-analysis.; Preeclampsia.
Conflict of interest statement
The authors declare that there is no conflict of interest.
Figures

Similar articles
-
Serum heat shock protein 70 in preeclampsia and normal pregnancy: A systematic review and meta-analysis.Int J Reprod Biomed. 2018 Jan;16(1):1-8. Int J Reprod Biomed. 2018. PMID: 29707695 Free PMC article. Review.
-
Systematic and meta-analysis of factors associated with preeclampsia and eclampsia in sub-Saharan Africa.PLoS One. 2020 Aug 19;15(8):e0237600. doi: 10.1371/journal.pone.0237600. eCollection 2020. PLoS One. 2020. PMID: 32813750 Free PMC article.
-
Can serum HCG values be used in the differential diagnosis of pregnancy complicated by hypertension?Hypertens Pregnancy. 2004;23(1):1-12. doi: 10.1081/PRG-120028276. Hypertens Pregnancy. 2004. PMID: 15117595
-
Management of preeclampsia.Pregnancy Hypertens. 2014 Jul;4(3):246-7. doi: 10.1016/j.preghy.2014.04.021. Epub 2014 Jul 9. Pregnancy Hypertens. 2014. PMID: 26104648
-
Assessment of occurrence of preeclampsia and some clinical and demographic risk factors in Zahedan city in 2017.Clin Exp Hypertens. 2019;41(6):583-588. doi: 10.1080/10641963.2018.1523919. Epub 2018 Nov 2. Clin Exp Hypertens. 2019. PMID: 30388904
Cited by
-
First-Trimester Maternal Serum Adiponectin/Leptin Ratio in Pre-Eclampsia and Fetal Growth.Life (Basel). 2023 Jan 3;13(1):130. doi: 10.3390/life13010130. Life (Basel). 2023. PMID: 36676079 Free PMC article.
-
Evaluating circulating soluble markers of endothelial dysfunction and risk factors associated with PE: A multicentre longitudinal case control study in northern Ghana.Heliyon. 2023 Aug 23;9(9):e19096. doi: 10.1016/j.heliyon.2023.e19096. eCollection 2023 Sep. Heliyon. 2023. PMID: 37662780 Free PMC article.
-
Non-invasive prediction of preeclampsia using the maternal plasma cell-free DNA profile and clinical risk factors.Front Med (Lausanne). 2024 Apr 17;11:1254467. doi: 10.3389/fmed.2024.1254467. eCollection 2024. Front Med (Lausanne). 2024. PMID: 38695016 Free PMC article.
-
Impact of maternal body mass index on pregnancy outcomes among Indian women.Bioinformation. 2024 Oct 31;20(10):1257-1260. doi: 10.6026/9732063002001257. eCollection 2024. Bioinformation. 2024. PMID: 40092876 Free PMC article.
-
Polygenic Risk Score and Risk Factors for Preeclampsia and Gestational Hypertension.J Pers Med. 2022 Nov 3;12(11):1826. doi: 10.3390/jpm12111826. J Pers Med. 2022. PMID: 36579561 Free PMC article.
References
-
- Cuningham F., Leveno K., Bloom S., Hauth J., Gilstrap L., Katharine W. Williams Obstetrics. 22th. New York: Mccraw-Hill; 2005. Williams obstetrics; p. 768.
-
- Cunnigham FG., Gant NF., Leveno KJ., Larry C. Obstetrics. Journal of Midwifery Womens Health. 2010:48–369.
-
- Shah S., Gupta A. Gupta A. Hypertensive disorders of pregnancy. Cardiol Clin. Vol. 37. 37: 345-354; 2019. Hypertensive disorders of pregnancy. Cardiol Clin; pp. 345–354. - PubMed
Publication types
LinkOut - more resources
Full Text Sources