

The relationship between systolic pulmonary arterial pressure and Tp-e interval, Tp-e/QT, and Tp-e/QTc ratios in patients with newly diagnosed chronic obstructive pulmonary disease
- PMID: 31508867
- PMCID: PMC7358838
- DOI: 10.1111/anec.12691
The relationship between systolic pulmonary arterial pressure and Tp-e interval, Tp-e/QT, and Tp-e/QTc ratios in patients with newly diagnosed chronic obstructive pulmonary disease
Abstract
Introduction: The risk of sudden cardiac death (SCD) and arrhythmias has been shown to be common in chronic obstructive pulmonary disease (COPD) subjects. We aimed to evaluate the markers of arrhythmia such as QT, QTc (corrected QT), Tp-e, and cTp-e (corrected Tp-e) intervals, Tp-e/QT ratio, and Tp-e/QTc ratio in newly diagnosed COPD subjects in both right and left precordial leads.
Materials and methods: The study group consisted of 74 subjects with obstructive respiratory function tests (RFTs). The control group consisted of 78 subjects who had nonobstructive RFTs. RFTs, electrocardiograms (ECG), and transthoracic echocardiograms (TTE) were performed, and QTR (QT interval in right precordial leads), QTL (QT interval in left precordial leads), Tp-eR (Tp-e interval in right precordial leads), and Tp-eL (Tp-e interval in left precordial leads) intervals; systolic pulmonary arterial pressure (sPAP); forced expiratory volume in one second (FEV1 )/forced vital capacity (FVC); and peripheral oxygen saturation(POS) values were measured.
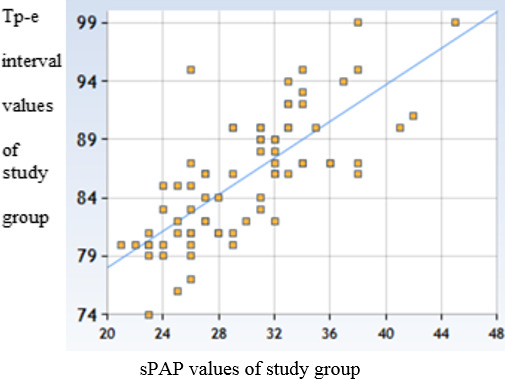
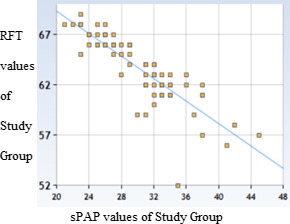
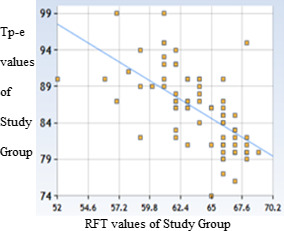
Results: Tp-eR interval 85.82 ± 5.34 millisecond (ms) versus 62.87 ± 3.55 ms (t = 31.29/p < .00001), cTp-eR interval 97.51 ± 7.18 ms versus 71.07 ± 4.58 ms (t = 27.20/p < .00001), Tp-eR/QTR ratio 0.234 ± 0.02 versus 0.164 ± 0.01 (t = 2.2/p = .014), and Tp-eR/QTcR ratio 0.201 ± 0.01 versus 0.141 ± 0.01 (t = 1.92/p = .028) were statistically significantly higher in COPD subjects. There was a strong negative correlation between RFT and sPAP (sPAP, 29.93 ± 5.1 mm Hg; and FEV1 /FVC, 63.78 ± 3.33%, r = -.85/p < .00001). There was a moderate positive correlation between sPAP and Tp-eR.
Conclusion: We found Tp-e and cTp-e intervals, Tp-e/QT ratio, and Tp-e/QTc ratio were significantly higher in the COPD patients than in the control group. In addition, in the COPD group, heart rate variability (HRV) parameters were significantly lower on ECG.
Keywords: Tp-e interval; Tp-e/QT ratio; Tp-e/QTc ratio; chronic obstructive pulmonary disease; respiratory function test; systolic pulmonary arterial pressure.
© 2019 Wiley Periodicals, LLC.
Conflict of interest statement
The authors declare that they have no conflict of interest. There is no source(s) of support in the form of grants, equipment, and drugs. All expenses are paid by the authors. The authors state that the manuscript has been read and approved by all the authors, that the requirements for authorship as stated earlier in this document have been met, and that each author believes that the manuscript represents honest work.
Figures
Similar articles
-
Evaluation of Tpeak-Tend interval and Tpeak-end/QT ratio in patients with Sarcoidosis.Sarcoidosis Vasc Diffuse Lung Dis. 2016 Aug 1;33(2):151-6. Sarcoidosis Vasc Diffuse Lung Dis. 2016. PMID: 27537718
-
Evaluation of electrocardiographic ventricular repolarization variables in patients with newly diagnosed COVID-19.J Electrocardiol. 2020 Sep-Oct;62:5-9. doi: 10.1016/j.jelectrocard.2020.07.005. Epub 2020 Jul 21. J Electrocardiol. 2020. PMID: 32731139 Free PMC article.
-
Variation of Tpeak-end, corrected Tpeak-end, QT, and corrected QT intervals, Tpeak-end/QT, Tpeak-end/corrected QT ratios and heart rate variability according to decades in the healthy male subjects aged between 30 and 79 years.J Arrhythm. 2020 Apr 13;36(3):508-517. doi: 10.1002/joa3.12339. eCollection 2020 Jun. J Arrhythm. 2020. PMID: 32528579 Free PMC article.
-
Electrocardiographic alterations in chronic obstructive pulmonary disease.J Electrocardiol. 2024 Jul-Aug;85:58-65. doi: 10.1016/j.jelectrocard.2024.05.083. Epub 2024 May 24. J Electrocardiol. 2024. PMID: 38865856 Review.
-
Echocardiographic systolic pulmonary arterial pressure and mortality in coronavirus disease 2019 patients.J Cardiovasc Med (Hagerstown). 2022 Jun 1;23(6):417-419. doi: 10.2459/JCM.0000000000001297. Epub 2020 Dec 10. J Cardiovasc Med (Hagerstown). 2022. PMID: 35013053
Cited by
-
Association of Chronic Obstructive Pulmonary Disease With Arrhythmia Risks: A Systematic Review and Meta-Analysis.Front Cardiovasc Med. 2021 Sep 30;8:732349. doi: 10.3389/fcvm.2021.732349. eCollection 2021. Front Cardiovasc Med. 2021. PMID: 34660734 Free PMC article.
-
Association between chronic obstructive pulmonary disease and ventricular arrhythmia: a nationwide population-based cohort study.NPJ Prim Care Respir Med. 2021 Feb 12;31(1):8. doi: 10.1038/s41533-021-00221-3. NPJ Prim Care Respir Med. 2021. PMID: 33580036 Free PMC article.
-
Tpeak-Tend ECG Marker in Obesity and Cardiovascular Diseases: A Comprehensive Review.Scientifica (Cairo). 2024 Jun 26;2024:4904508. doi: 10.1155/2024/4904508. eCollection 2024. Scientifica (Cairo). 2024. PMID: 38962529 Free PMC article. Review.
References
-
- Boutou, A. K. , Franks, R. , Mohan, D. , Mantziari, L. , Wong, T. , Hopkinson, N. S. , & Polkey, M. I. (2017). Exercise‐induced changes in QT interval are smaller in COPD patients and have no impact on mortality. European Respiratory Journal, 49(3), 1602394 10.1183/13993003.02394-2016 - DOI - PubMed
-
- US Preventive Services Task Force , Curry, S. J. , Krist, A. H. , Owens, D. K. , Barry, M. J. , Caughey, A. B. , … Wong, J. B. (2018). Screening for cardiovascular disease risk with electrocardiography: US preventive services task force recommendation statement. Journal of the American Medical Association, 319(22), 2308–2314. 10.1001/jama.2018.6848 - DOI - PubMed
MeSH terms
LinkOut - more resources
Full Text Sources
Medical
Research Materials
