

Quantifying Drug-Induced Bone Marrow Toxicity Using a Novel Haematopoiesis Systems Pharmacology Model
- PMID: 31508894
- PMCID: PMC6875710
- DOI: 10.1002/psp4.12459
Quantifying Drug-Induced Bone Marrow Toxicity Using a Novel Haematopoiesis Systems Pharmacology Model
Abstract
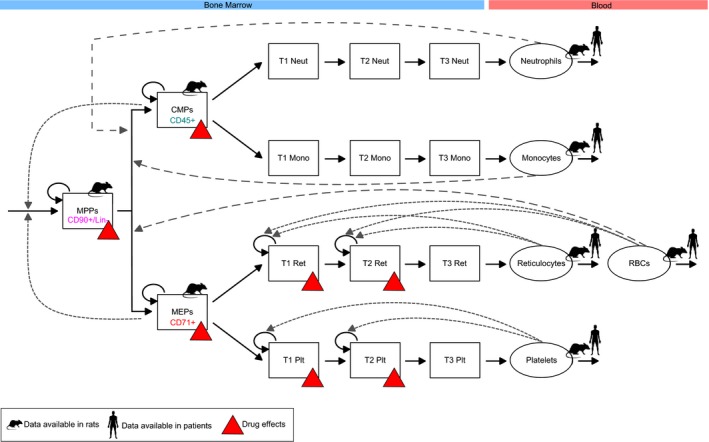
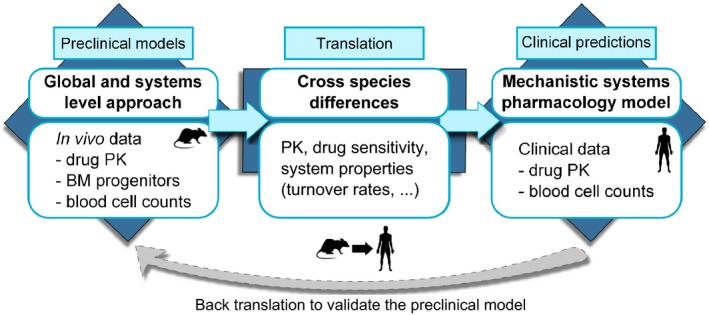
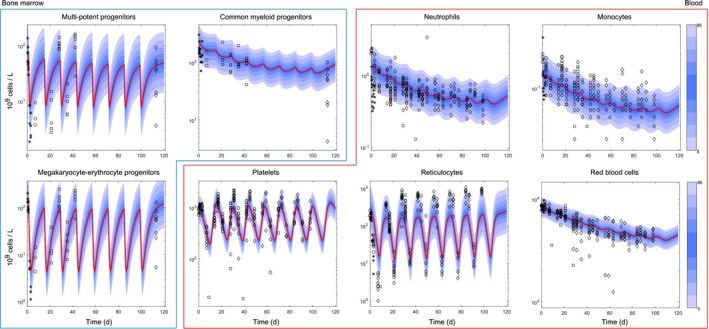
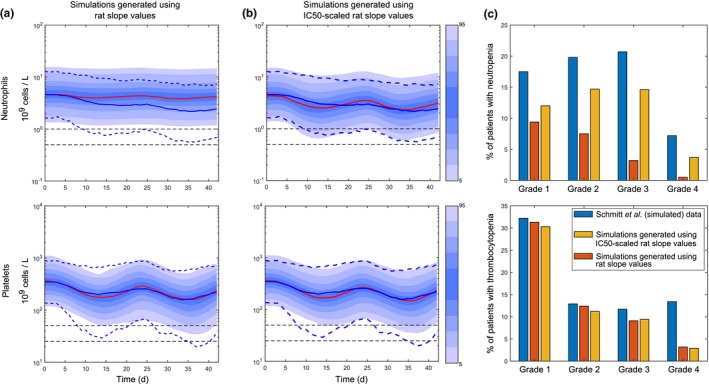
Haematological toxicity associated with cancer therapeutics is monitored by changes in blood cell count, and their primary effect is on proliferative progenitors in the bone marrow. Using observations in rat bone marrow and blood, we characterize a mathematical model that comprises cell proliferation and differentiation of the full haematopoietic phylogeny, with interacting feedback loops between lineages in homeostasis as well as following carboplatin exposure. We accurately predicted the temporal dynamics of several mature cell types related to carboplatin-induced bone marrow toxicity and identified novel insights into haematopoiesis. Our model confirms a significant degree of plasticity within bone marrow cells, with the number and type of both early progenitors and circulating cells affecting cell balance, via feedback mechanisms, through fate decisions of the multipotent progenitors. We also demonstrated cross-species translation of our predictions to patients, applying the same core model structure and considering differences in drug-dependent and physiology-dependent parameters.
© 2019 Astrazeneca CPT: Pharmacometrics & Systems Pharmacology published by Wiley Periodicals, Inc. on behalf of the American Society for Clinical Pharmacology and Therapeutics.
Conflict of interest statement
C.F., L.O.O.C., C.P., J.W.T.Y., J.T.M., and T.A.C. are AstraZeneca employees; J.W.T.Y., T.A.C., and L.O.O.C. are shareholders of AstraZeneca. D.I.J. receives funding for clinical trials and associated laboratory studies from AstraZeneca.
Figures
Similar articles
-
Effect of salidroside on bone marrow haematopoiesis in a mouse model of myelosuppressed anaemia.J Radiat Res. 2019 Mar 1;60(2):197-203. doi: 10.1093/jrr/rry093. J Radiat Res. 2019. PMID: 30462331 Free PMC article.
-
Ginsenoside Rg1 improves bone marrow haematopoietic activity via extramedullary haematopoiesis of the spleen.J Cell Mol Med. 2015 Nov;19(11):2575-86. doi: 10.1111/jcmm.12643. Epub 2015 Jul 8. J Cell Mol Med. 2015. PMID: 26153045 Free PMC article.
-
Parathyroid hormone administration improves bone marrow microenvironment and partially rescues haematopoietic defects in Bmi1-null mice.PLoS One. 2014 Apr 4;9(4):e93864. doi: 10.1371/journal.pone.0093864. eCollection 2014. PLoS One. 2014. PMID: 24705625 Free PMC article.
-
Obesity-driven disruption of haematopoiesis and the bone marrow niche.Nat Rev Endocrinol. 2014 Dec;10(12):737-48. doi: 10.1038/nrendo.2014.169. Epub 2014 Oct 14. Nat Rev Endocrinol. 2014. PMID: 25311396 Review.
-
In Vitro Human Haematopoietic Stem Cell Expansion and Differentiation.Cells. 2023 Mar 14;12(6):896. doi: 10.3390/cells12060896. Cells. 2023. PMID: 36980237 Free PMC article. Review.
Cited by
-
Importance of Stability Analysis When Using Nonlinear Semimechanistic Models to Describe Drug-Induced Hematotoxicity.CPT Pharmacometrics Syst Pharmacol. 2020 Sep;9(9):498-508. doi: 10.1002/psp4.12514. Epub 2020 Jul 8. CPT Pharmacometrics Syst Pharmacol. 2020. PMID: 32453487 Free PMC article.
-
Predicting Chemotherapy-Induced Neutropenia and Granulocyte Colony-Stimulating Factor Response Using Model-Based In Vitro to Clinical Translation.AAPS J. 2020 Nov 6;22(6):143. doi: 10.1208/s12248-020-00529-x. AAPS J. 2020. PMID: 33156437 Free PMC article. Clinical Trial.
-
Chemotherapy-induced thrombocytopenia: literature review.Discov Oncol. 2023 Jan 25;14(1):10. doi: 10.1007/s12672-023-00616-3. Discov Oncol. 2023. PMID: 36695938 Free PMC article. Review.
-
Efficacy of Poloxamer 188 in Experimental Myelosuppression Model Induced by Carboplatin in CBA Mice.Int J Mol Sci. 2025 Jul 23;26(15):7081. doi: 10.3390/ijms26157081. Int J Mol Sci. 2025. PMID: 40806214 Free PMC article.
-
An in vitro quantitative systems pharmacology approach for deconvolving mechanisms of drug-induced, multilineage cytopenias.PLoS Comput Biol. 2020 Jul 23;16(7):e1007620. doi: 10.1371/journal.pcbi.1007620. eCollection 2020 Jul. PLoS Comput Biol. 2020. PMID: 32701980 Free PMC article.
References
-
- Barreto, J.N. , McCullough, K.B. , Ice, L.L. & Smith, J.A. Antineoplastic agents and the associated myelosuppressive effects: a review. J. Pharm. Pract. 27, 440–446 (2014). - PubMed
-
- Alberts, D. & Dorr, R. New perspectives on an old friend: optimizing carboplatin for the treatment of solid tumors. Oncologist 3, 15–34 (1998). - PubMed
-
- Jodrell, D.I. et al Relationships between carboplatin exposure and tumor response and toxicity in patients with ovarian cancer. J. Clin. Oncol. 10, 520–528 (1992). - PubMed
-
- Schmitt, A. et al Factors for hematopoietic toxicity of carboplatin: refining the targeting of carboplatin systemic exposure. J. Clin. Oncol. 28, 4568–4574 (2010). - PubMed
Publication types
MeSH terms
Substances
Grants and funding
LinkOut - more resources
Full Text Sources
