. 2019 Nov 1;317(5):F1383-F1397.
doi: 10.1152/ajprenal.00366.2019. Epub 2019 Sep 11.

Capillary rarefaction is more closely associated with CKD progression after cisplatin, rhabdomyolysis, and ischemia-reperfusion-induced AKI than renal fibrosis

Affiliations

Capillary rarefaction is more closely associated with CKD progression after cisplatin, rhabdomyolysis, and ischemia-reperfusion-induced AKI than renal fibrosis

Anna Menshikh et al. Am J Physiol Renal Physiol. .

Abstract

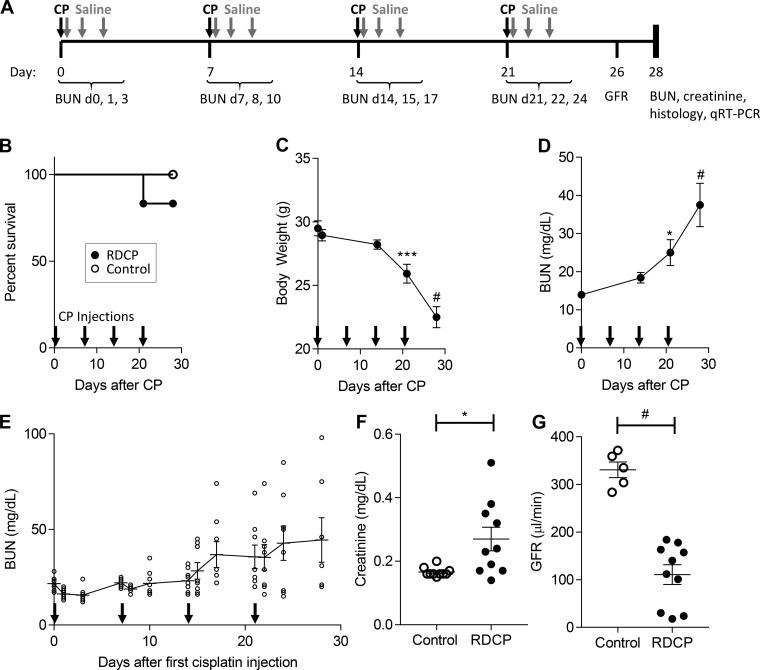
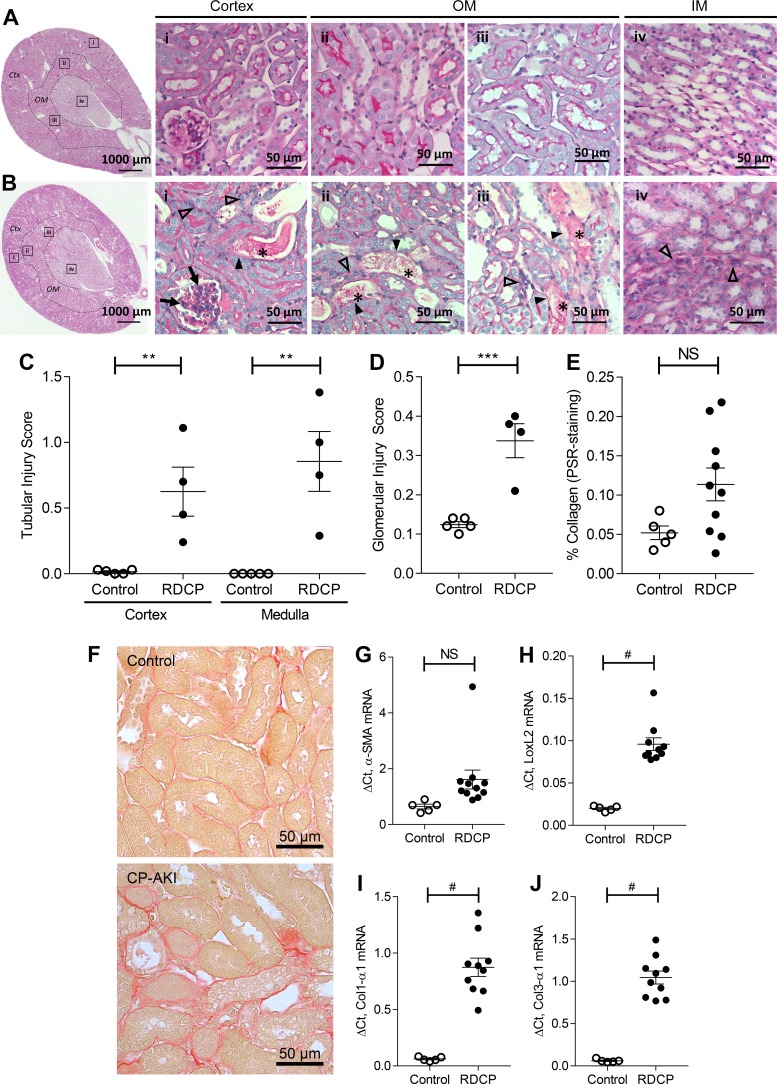
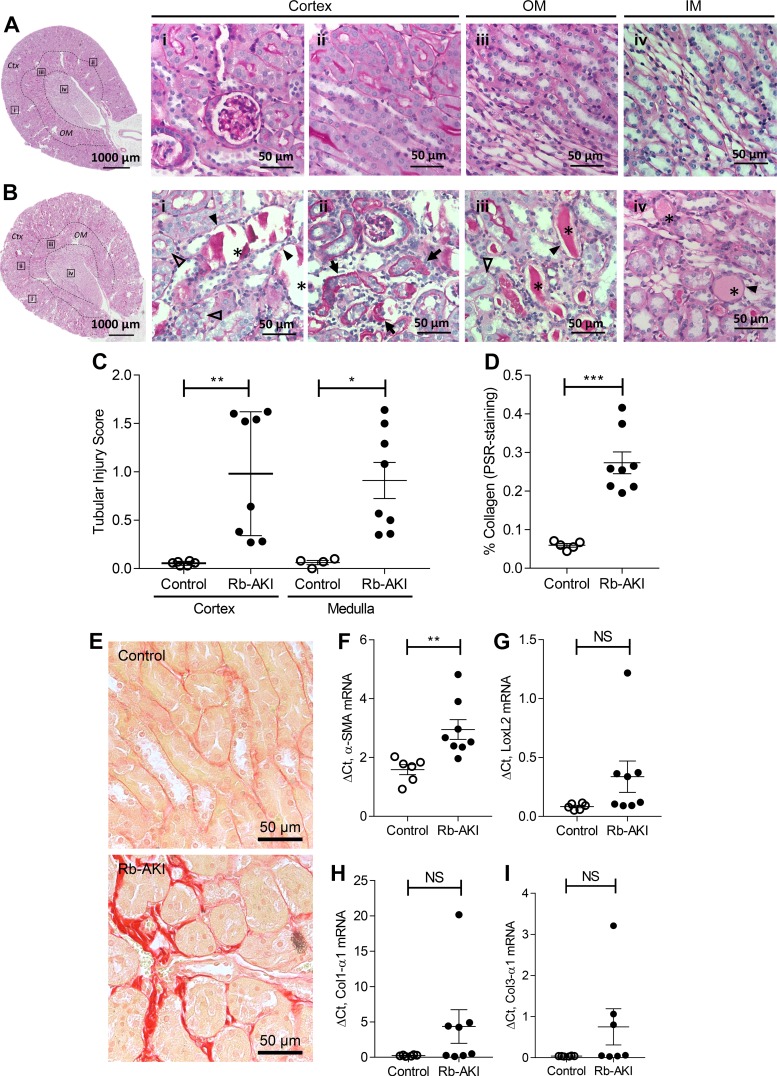
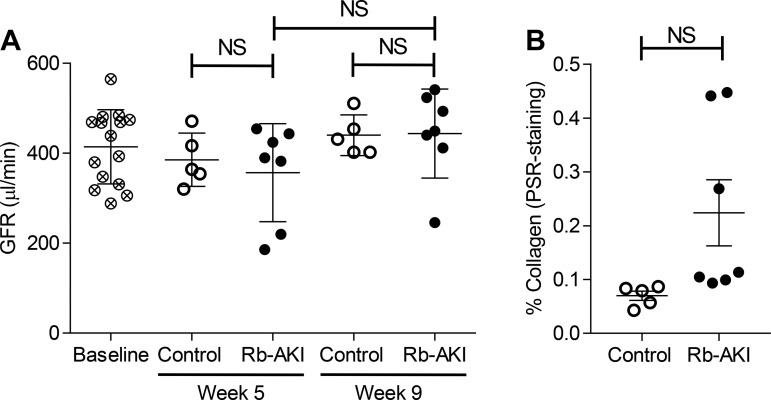
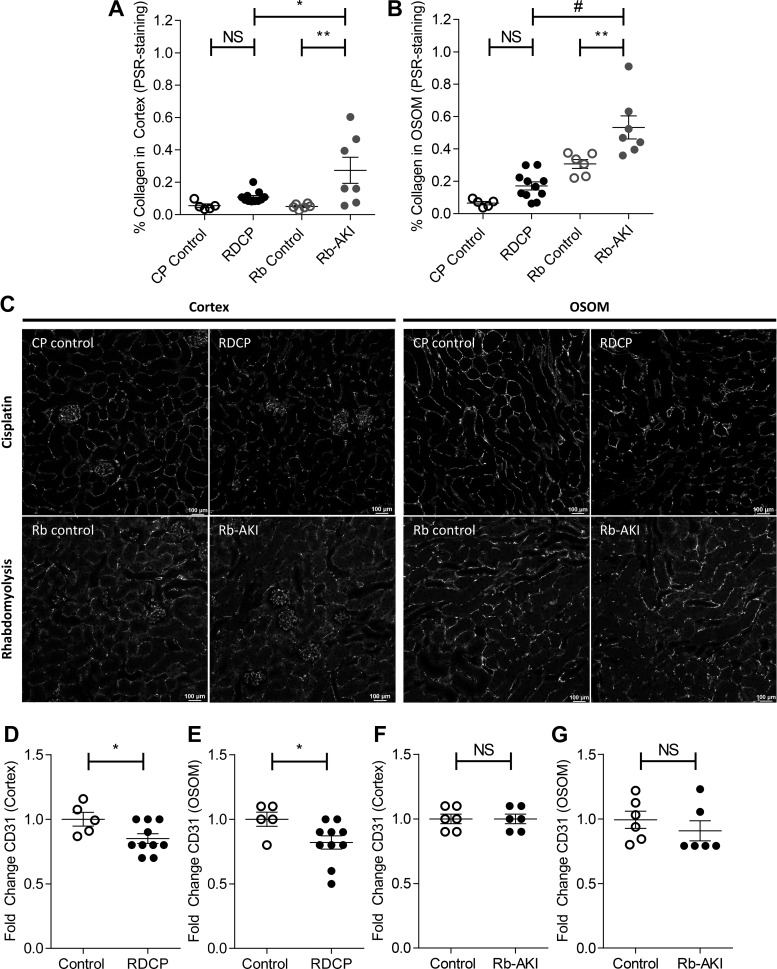
Acute kidney injury (AKI) is a strong independent predictor of mortality and often results in incomplete recovery of renal function, leading to progressive chronic kidney disease (CKD). Many clinical trials have been conducted on the basis of promising preclinical data, but no therapeutic interventions have been shown to improve long-term outcomes after AKI. This is partly due to the failure of preclinical studies to accurately model clinically relevant injury and long-term outcomes on CKD progression. Here, we evaluated the long-term effects of AKI on CKD progression in three animal models reflecting diverse etiologies of AKI: repeat-dose cisplatin, rhabdomyolysis, and ischemia-reperfusion injury. Using transdermal measurement of glomerular filtration rate as a clinically relevant measure of kidney function and quantification of peritubular capillary density to measure capillary rarefaction, we showed that repeat-dose cisplatin caused capillary rarefaction and decreased renal function in mice without a significant increase in interstitial fibrosis, whereas rhabdomyolysis-induced AKI led to severe interstitial fibrosis, but renal function and peritubular capillary density were preserved. Furthermore, long-term experiments in mice with unilateral ischemia-reperfusion injury showed that restoration of renal function 12 wk after a contralateral nephrectomy was associated with increasing fibrosis, but a reversal of capillary rarefaction was seen at 4 wk. These data demonstrate that clear dissociation between kidney function and fibrosis in these models of AKI to CKD progression and suggest that peritubular capillary rarefaction is more strongly associated with CKD progression than renal fibrosis.

Keywords: acute kidney injury; capillary rarefaction; chronic kidney disease; glomerular filtration rate; renal fibrosis.


Conflict of interest statement

No conflicts of interest, financial or otherwise, are declared by the authors.

Figures

Fig. 1.
Fig. 1.
Repeated-dose cisplatin (RDCP) model in male FVB/N mice. A: schematic of the RDCP study design. Fourteen-week-old male mice were administered a low dose (7 mg/kg) of CP (RDCP; n = 12) or vehicle (control; n = 5) once weekly for 4 wk (black arrows). Saline (0.5 ml of 0.9% saline) was administered immediately and 1 and 2 days after each CP injection to treat salt wasting (gray arrows). B: survival of mice over time. C: changes in body weight over time. D: changes in blood urea nitrogen (BUN) levels over time. E: BUN levels measured before and 1 and 3 days after each CP injection in a separate cohort of mice (n = 10). F: serum creatinine at the study end point (day 28). G: glomerular filtration rate (GFR) calculated from transdermal measurement of FITC-sinistrin clearance on day 26. Data points in B represent percent survival. Data points in C and D represent means ± SE. Data points in E–G represent individual animals, with means ± SE of the groups indicated, and the solid line in E connects the mean values over time. One-way ANOVA was used to determine statistical significance, and post hoc Dunnett’s multiple-comparison test was used to compare with baseline day 0 (C and D). A two-sided t-test was used to compare RDCP to controls in F and G. *P ≤ 0.05; ***P ≤ 0.001; #P ≤ 0.0001.
Fig. 2.
Fig. 2.
Tubular injury and fibrosis after repeated-dose cisplatin (RDCP). AD: data from a separate cohort of mice given 7 mg/kg CP (n = 4) or vehicle (n = 5) weekly for 4 wk. A and B: representative images of a control kidney (A) and a CP-induced acute kidney injury (CP-AKI) kideny (B) at day 28. The highlighted boxes (i–iv) in the low-power images correspond to the magnified images to the right. In injured kidneys (B), dilated tubules with casts (*) show deepithelialization (solid arrowheads). Cortical glomeruli have mesangial expansion (arrows). Intratubular fibrosis and hypercellularity (open arrowheads) are found in the cortex (Ctx; i), outer medulla (OM; ii and iii), and inner medulla (IM; iv). C: tubular injury scores in the Ctx and OM from periodic acid-Schiff-stained kidney sections at day 28. D: glomerular injury score from periodic acid-Schiff-stained kidney sections at day 28. EI: data from the same cohort of mice shown in Fig. 1. E: quantification of renal fibrosis (picrosirius red staining) in the OM at day 28. F: representative images of the OM of picrosirius red-stained kidney sections. G−J: mRNA expression of the following fibrosis markers: α-smooth muscle actin (α-SMA; G), lysyl oxidase-like 2 (LoxL2; H), collagen type I-α1 (Col1-α1; I), and collagen type III-α3 (Col3-α1; J) relative to GAPDH on day 28. Data points in CE and GJ represent individual animals, with means ± SE of the groups indicated. A two-sided t-test was used to compare RDCP to control mice in CE and GJ. NS, not significant (P > 0.05). **P ≤ 0.01; ***P ≤ 0.001; #P ≤ 0.0001.
Fig. 3.
Fig. 3.
Rhabdomyolysis-induced acute kidney injury (Rb-AKI) model in male BALB/c mice. A: schematic of the Rb-AKI study design. Eighteen-week-old male BALB/c mice were water restricted for 18 h before intramuscular administration of 6 ml/kg of 50% glycerol or vehicle. B: survival of mice over time. C: changes in body weight over time. D: changes in blood urea nitrogen (BUN) levels over time. E: creatinine measured at the study end point (day 36). F: glomerular filtration rate (GFR) calculated from transdermal measurement of FITC-sinistrin clearance on day 35. Data points in B represent percent survival. Data points in C and D represent means ± SE. Data points in E and F represent individual animals, with means ± SE of the groups indicated. One-way ANOVA (C) and two-way ANOVA (D) were used to determine statistical significance, and a post hoc Dunnett’s multiple-comparisons test was used to compare with baseline day 0 (C and D). A two-sided t test was used to compare Rb-AKI with control mice in E and F. NS, not significant (P > 0.05). *P ≤ 0.05; #P ≤ 0.0001.
Fig. 4.
Fig. 4.
Tubular injury and fibrosis after rhabdomyolysis-induced acute kidney injury (Rb-AKI). A and B: representative images of a control kidney (A) and a Rb-AKI kidney (B) at day 36. The highlighted boxes (i–iv) in the low-power images correspond to the magnified images to the right. In injured kidneys (B), cortical tubules were dilated with friable casts (i, *), while the outer (OM; iii) and inner medulla (IM; iv) had solid casts (*). There was also peritubular fibrosis with interstitial proliferation in the cortex (Ctx; ii, arrows) and OM (not shown). Tubules also showed deepithelialization (closed arrowheads) and epithelial vacuoles (open arrowheads). C: tubular injury scores in the Ctx and OM from periodic acid-Schiff-stained kidney sections at day 36. D: quantification of renal fibrosis (picrosirius red staining) in the OM at day 36. E: representative images of the OM of picrosirius red-stained kidney sections. F−I: mRNA expression of the following fibrosis markers: α-smooth muscle actin (α-SMA; F), lysyl oxidase-like 2 (LoxL2; G), collagen type I-α1 (Col1-α1; H), and collagen type III-α1 (Col3-α1; I) relative to GAPDH on day 36. Data points in C, D, and FI represent individual animals, with means ± SE of the groups indicated. A two-sided t-test was used to compare Rb-AKI with control mice in C, D, and FI. NS, not significant (P > 0.05). **P ≤ 0.01; ***P ≤ 0.001.
Fig. 5.
Fig. 5.
Renal function and fibrosis 9 wk after rhabdomyolysis-induced acute kidney injury (Rb-AKI). A separate cohort of Rb-AKI (n = 7) and control (n = 5) mice underwent the same experimental protocol shown in Fig. 3A except that mice were monitored for 9 wk. A: glomerular filtration rate (GFR) calculated from transdermal measurement of FITC-sinistrin clearance at baseline, week 5, and week 9. B: quantification of renal fibrosis (picrosirius red staining) in the outer medulla at week 9. Data points represent individual animals, with means ± SE of the groups indicated. One-way ANOVA was used to determine statistical significance, and a post hoc Dunnett’s multiple-comparison test was used to determine pairwise significance. A two-sided t-test was used to compare Rb-AKI with control mice in B. NS, not significant (P > 0.05).
Fig. 6.
Fig. 6.
Renal fibrosis and capillary rarefaction in the repeated-dose cisplatin (RDCP) and rhabdomyolysis (Rb)-induced acute kidney injury (Rb-AKI) models. Quantification of fibrosis [picrosirius red (PSR) staining] was repeated to compare both models side by side. A and B: renal fibrosis (PSR staining) in the cortex (A) and outer stripe of the outer medulla (OSOM; B) at day 28 in RDCP and CP control mice and at day 36 in Rb-AKI and Rb control mice. CG: capillary rarefaction was quantified as the fold change in CD31 staining in the cortex and OSOM at day 28 in CP-AKI and CP control mice (D and E) and at day 36 in Rb-AKI and Rb control mice (F and G). Data points represent individual animals, with means ± SE of the groups indicated. One-way ANOVA was used to determine statistical significance, and a post hoc Dunnett’s multiple-comparisons test was used to determine pairwise significance to compare RDCP vs. CP control, Rb-AKI vs. Rb control, and RDCP vs. Rb-AKI mice. P values were adjusted for multiple comparisons using Sidak’s multiple-comparison test. A two-sided t-test was used to compare RDCP and Rb-AKI groups with their respective control groups in DG. NS, not significant (P > 0.05). *P ≤ 0.05; **P ≤ 0.01; #P ≤ 0.0001.
Fig. 7.
Fig. 7.
Ischemia-reperfusion injury (IRI) with delayed contralateral nephrectomy (Nx) (DN-IRI model) in male BALB/c mice. A: schematic of the DN-IRI study design. Eleven-week-old male BALB/c mice underwent 30 min of unilateral renal ischemia followed by a contralateral Nx 8 days later (n = 5) or Nx only (n = 5). B: glomerular filtration rate (GFR) calculated from transdermal measurement of FITC-sinistrin clearance at baseline, day 9 (1 day after Nx), and weeks 2, 3, 4, 6, 8, and 12. C: quantification of renal fibrosis [picrosirius red (PSR) staining] in the outer medulla at weeks 4 and 12. D: representative images of the outer medulla of PSR-stained kidney sections. E−G: fold changes of mRNA expression of the following fibrosis markers: α-smooth muscle actin (α-SMA; E), lysyl oxidase-like 2 (LoxL2; F), collagen type I-α1 (Col1-α1; G), and collagen type III-α1 (Col3-α1; H) relative to GAPDH at weeks 4 and 12. Bars in B represent means ± SE. Data points in C and EH represent individual animals, with means ± SE of the groups indicated. Two-way ANOVA (B) or one-way ANOVA (C, EH) was used to determine statistical significance, and a post hoc Dunnett’s multiple-comparison test was used to determine pairwise significance compared with Nx control mice within each time point. NS, not significant (P > 0.05). *P ≤ 0.05; **P ≤ 0.01; ***P ≤ 0.001.
Fig. 8.
Fig. 8.
Capillary rarefaction after ishemia-repefusion injury with a delayed contralateral nephrectomy (Nx) (DN-IRI model). A and B: capillary rarefaction was quantified as the fold change in CD31 staining in the cortex and outer medulla at weeks 4 and 12 in DN-IRI and Nx control mice. Data points represent individual animals, with means ± SE of the groups indicated. One-way ANOVA was used to determine statistical significance, and a post hoc Dunnett’s multiple-comparison test was used to determine pairwise significance. NS, not significant (P > 0.05). *P ≤ 0.05; **P ≤ 0.01.

Comment in

Similar articles

Cited by

References

    1. Bábíčková J, Klinkhammer BM, Buhl EM, Djudjaj S, Hoss M, Heymann F, Tacke F, Floege J, Becker JU, Boor P. Regardless of etiology, progressive renal disease causes ultrastructural and functional alterations of peritubular capillaries. Kidney Int 91: 70–85, 2017. doi:10.1016/j.kint.2016.07.038. - DOI - PubMed
    1. Basile DP, Donohoe D, Roethe K, Osborn JL. Renal ischemic injury results in permanent damage to peritubular capillaries and influences long-term function. Am J Physiol Renal Physiol 281: F887–F899, 2001. doi:10.1152/ajprenal.00050.2001. - DOI - PubMed
    1. Basile DP. Rarefaction of peritubular capillaries following ischemic acute renal failure: a potential factor predisposing to progressive nephropathy. Curr Opin Nephrol Hypertens 13: 1–7, 2004. doi:10.1097/00041552-200401000-00001. - DOI - PubMed
    1. Belliere J, Casemayou A, Ducasse L, Zakaroff-Girard A, Martins F, Iacovoni JS, Guilbeau-Frugier C, Buffin-Meyer B, Pipy B, Chauveau D, Schanstra JP, Bascands JL. Specific macrophage subtypes influence the progression of rhabdomyolysis-induced kidney injury. J Am Soc Nephrol 26: 1363–1377, 2015. doi:10.1681/ASN.2014040320. - DOI - PMC - PubMed
    1. Bellomo R, Kellum JA, Ronco C. Acute kidney injury. Lancet 380: 756–766, 2012. doi:10.1016/S0140-6736(11)61454-2. - DOI - PubMed

Publication types