. 2019 Nov 1;317(5):F1318-F1330.
doi: 10.1152/ajprenal.00204.2019. Epub 2019 Sep 11.

In utero exposure to maternal diabetes impairs nephron progenitor differentiation

Affiliations

In utero exposure to maternal diabetes impairs nephron progenitor differentiation

Débora M Cerqueira et al. Am J Physiol Renal Physiol. .

Abstract

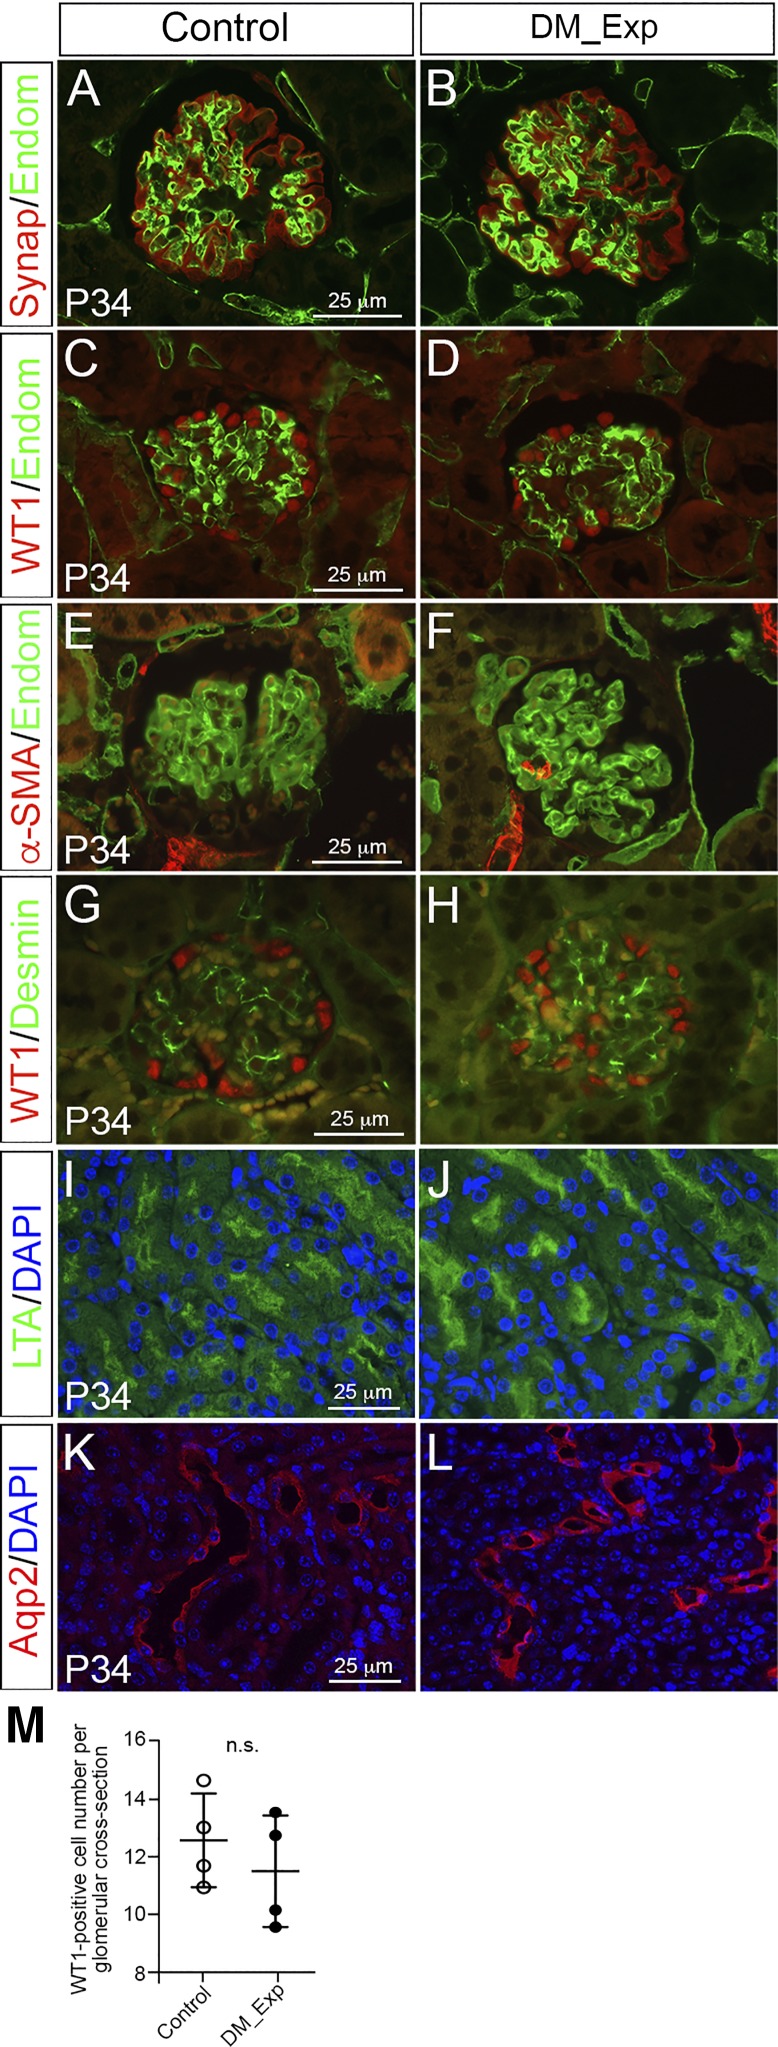
The incidence of diabetes mellitus has significantly increased among women of childbearing age, and it has been shown that prenatal exposure to maternal diabetes increases the risk of associated congenital anomalies of the kidney. Congenital anomalies of the kidney are among the leading causes of chronic kidney disease in children. To better understand the effect of maternal diabetes on kidney development, we analyzed wild-type offspring (DM_Exp) of diabetic Ins2+/C96Y mice (Akita mice). DM_Exp mice at postnatal day 34 have a reduction of ~20% in the total nephron number compared with controls, using the gold standard physical dissector/fractionator method. At the molecular level, the expression of the nephron progenitor markers sine oculis homeobox homolog 2 and Cited1 was increased in DM_Exp kidneys at postnatal day 2. Conversely, the number of early developing nephrons was diminished in DM_Exp kidneys. This was associated with decreased expression of the intracellular domain of Notch1 and the canonical Wnt target lymphoid enhancer binding factor 1. Together, these data suggest that the diabetic intrauterine environment impairs the differentiation of nephron progenitors into nephrons, possibly by perturbing the Notch and Wnt/β-catenin signaling pathways.

Keywords: diabetes; kidney development; nephron formation; nephron progenitor.


Conflict of interest statement

No conflicts of interest, financial or otherwise, are declared by the authors.

Figures

Fig. 1.
Fig. 1.
Maternal blood glucose concentration is elevated in Ins2+/C96Y mice. A and B: schematic of the breeding strategy. The generation of C57BL/6J control and wild-type offspring exposed to maternal diabetes in utero (DM_Exp) mice is shown. C: blood glucose levels were measured throughout the first pregnancy in C57BL/6J control (n = 8 mice, 8 gestation periods) and Ins2+/C96Y (n = 18 mice, 18 gestation periods) mice. Mice were considered diabetic if their blood glucose levels exceeded 250 mg/dl for at least 5 consecutive days. Comparisons between groups were made using a linear mixed model followed by Sidak’s post hoc test. D: there was no difference in litter size between C57BL/6J control mice and mice exposed to maternal diabetes in utero (n = 24 litters from at least 12 different C57BL/6J control dams and n = 33 litters from at least 20 different Ins2+/C96Y dams). A Mann-Whitney test was used to determine statistical significance. Error bars represent SDs. *P ≤ 0.05; **P ≤ 0.01; ***P ≤ 0.001; ****P ≤ 0.0001. n.s., not significant.
Fig. 2.
Fig. 2.
The overall kidney morphology is normal in postnatal day 0 (P0) DM_Exp mice. There were no significant differences between newborn C57BL/6J control and DM_Exp mice of either sex regarding crown-rump length (A), body weight (B), kidney weight (C), and kidney-to-body weight ratio (D). Only one male and one female offspring from each litter were analyzed (n = 8 litters from 7 different C57BL/6J control dams and n = 7 litters from 7 different Ins2+/C96Y dams). Two-way ANOVA followed by multiple comparisons with Tukey’s method was used to determine statistical significance. Error bars represent SDs. Hematoxylin and eosin (H&E) staining of P0 kidneys from control (E) and DM_Exp (F) mice demonstrated no differences in gross renal histology. Arrowheads indicate glomeruli. Images shown are representative of three independent experiments (n = 3 male mice per condition derived from 3 different litters). Scale bar = 50 μm. n.s., not significant.
Fig. 3.
Fig. 3.
DM_Exp mice exhibit normal gross renal morphology at postnatal day 2 (P2). There were no significant differences between newborn C57BL/6J control and DM_Exp mice of either sex regarding crown-rump length (A), body weight (B), kidney weight (C), and kidney-to-body weight ratio (D). Only one male and one female offspring from each litter were analyzed (n = 6 litters from at least 4 different C57BL/6J control dams and n = 7 litters from 7 different Ins2+/C96Y dams). Two-way ANOVA followed by multiple comparisons with Tukey’s method was used to determine statistical significance. Error bars represent SDs. Hematoxylin and eosin (H&E) staining of P2 kidneys from control (E) and DM_Exp (F) mice demonstrated no differences in gross renal histology. Arrowheads indicate glomeruli. Images shown are representative of three independent experiments (n = 3 male mice per condition derived from 3 different litters). Scale bar = 50 μm. n.s., not significant.
Fig. 4.
Fig. 4.
DM_Exp mice exhibit a nephron deficit. At postnatal day 34 (P34), no significant differences were found between C57BL/6J control and DM_Exp mice of either sex regarding body weight (A), kidney weight (B), and kidney-to-body weight ratio (C) (n = 7 litters from 6 different C57BL/6J control dams and n = 6 litters from 6 different Ins2+/C96Y dams). Two-way ANOVA followed by multiple comparisons with Tukey’s method was used to determine statistical significance. Error bars represent SDs. D and E: hematoxylin and eosin (H&E) staining of P34 kidney sections from control (D) and DM_Exp (E) mice. Arrowheads indicate glomeruli. Images shown are representative of three independent experiments (n = 3 male mice per condition derived from 3 different litters). Scale bar = 25 μm. F: stereological analyses of kidneys from male C57BL/6J control and DM_Exp mice demonstrated a reduction of ~20% in the number of glomeruli in DM_Exp kidneys (n = 4 litters from 4 different C57BL/6J control dams and n = 4 litters from 4 different Ins2+/C96Y dams). A Mann-Whitney test was used to determine statistical significance. Error bars represent SDs. *P ≤ 0.05. n.s., not significant.
Fig. 5.
Fig. 5.
Differentiation of the existing nephrons in DM_Exp mice is normal. A−H: immunofluorescence on kidney sections from postnatal day 34 (P34) control and DM_Exp mice for the podocyte marker synaptopodin (Synap; red) and the endothelial marker endomucin (Endom; green) (A and B), podocyte marker Wilms’ tumor 1 (WT1; red) and Endom (green) (C and D), Endom (green) and α-smooth muscle actin (α-SMA; red) (α-SMA staining distinguishes the vascular pole of glomeruli) (E and F), and WT1 (red) and the mesangial marker desmin (green) (G and H). I and J: proximal tubules were visualized with fluorescein-labeled Lotus tetragonolobus lectin (LTA; green). K and L: collecting ducts were visualized with an anti-aquaporin 2 (Aqp2) antibody (red). Nuclei were counterstained with DAPI (blue). Images shown are representative of three independent experiments (n = 3 male mice per condition derived from 3 different litters). Scale bar = 25 μm. M: semiquantitative analysis of the immunostaining shown in G and H demonstrated no significant changes in the number of WT1-positive cells per glomerular cross-section between control and DM_Exp kidneys (n = 4 litters from 4 different C57BL/6J control dams and n = 4 litters from 4 different Ins2+/C96Y dams). A Mann-Whitney test was used to determine statistical significance. Error bars represent SDs. n.s., not significant.
Fig. 6.
Fig. 6.
Control and DM_Exp kidneys are phenotypically similar at postnatal day 0 (P0). A−H: coimmunostaining on kidney sections from P0 control and DM_Exp mice using anti-sine oculis homeobox homolog 2 (Six2; red) and anti-E-cadherin (E-cad; green) antibodies (A and B), anti-neural cell adhesion molecule (NCAM; red) and anti-cleaved caspase 3 (cl. casp3; green) (C and D), anti-NCAM (red) and anti-phosphorylated histone H3 (pHH3; green) (E and F), and anti-Jagged1 antibody (red) and fluorescein-labeled Dolichos biflorus agglutinin (DBA; green) (G and H). Images shown are representative of three independent experiments (n = 3 male mice per condition derived from 3 different litters). Scale bar = 50 μm. I: quantitative PCR analysis comparing the levels of the nephron progenitor markers Osr1, Eya1, Sall1, Cited1, and Six2 between control and DM_Exp kidneys. No significant differences in these transcripts were observed between these two conditions (n = 5 litters from 4 different C57BL/6J control dams and n = 5 litters from 4 different Ins2+/C96Y dams). J: Western blots demonstrating the expression of Jagged1 and Six2 in control and DM_Exp kidneys. β-Tubulin was used a loading control. Densitometric analyses of the bands on the Western blots shown in J demonstrated no difference in the expression of either Jagged1 or Six2 (normalized to β-tubulin) between control and DM_Exp kidneys (bottom). K and L: Quantification of immunostaining for NCAM/cleaved caspase-3 (K) and NCAM/phosphorylated histone H3 (pHH3; L) double-positive cells demonstrated no changes in apoptotic and proliferative status of NCAM-positive nephron progenitors between control and DM_Exp kidneys. M: Semiquantitative analysis of the number of Jagged1-positive structures demonstrated no changes between control and DM_Exp kidneys (n = 4 litters from 3 different C57BL/6J control dams and n = 4 litters from 3 different Ins2+/C96Y dams). A Mann-Whitney test was used to determine statistical significance. Error bars represent SDs. n.s., not significant.
Fig. 7.
Fig. 7.
Sine oculis homeobox homolog 2 (Six2) and Cited1 expression in nephron progenitors of DM_Exp kidneys is increased. A and B: immunofluorescence on kidney sections from postnatal day 2 (P2) control and DM_Exp mice using anti-Six2 antibody (red). The ureteric bud and collecting duct system were visualized using anti-E-cadherin antibody (E-cad; green). DM_Exp kidneys exhibited an increased number of Six2-positive nephron progenitors clustering around the ureteric bud tips. CF: coimmunostaining on kidney sections from P2 control and DM_Exp mice using an anti-Six2 (red) and anti-cleaved caspase 3 (cl. casp3, green) antibodies and anti-Six2 (red) and anti-phosphorylated histone H3 (pHH3, green) antibodies. Images shown are representative of three independent experiments (n = 3 male mice per condition derived from 3 different litters). Scale bar = 25 μm. G: quantitative PCR analysis comparing the levels of the nephron progenitor markers Osr1, Eya1, Sall1, Cited1, and Six2 in kidneys from male control and DM_Exp mice at P2. No significant differences in the levels of Osr1, Eya1, or Sall1 transcripts were detected. Conversely, Cited1 and Six2 were significantly increased in DM_Exp kidneys (n = 5 litters from 4 different C57BL/6J control dams and n = 5 litters from 4 different Ins2+/C96Y dams). H: Western blot analysis confirmed increased Six2 expression in DM_Exp kidneys. Densitometric analyses of the bands on the Western blots shown in H demonstrated increased Six2 expression in DM_Exp kidneys (bottom) normalized to β-tubulin (n = 4 litters from 3 different C57BL/6J control dams and n = 4 litters from 4 different Ins2+/C96Y dams). I and J: quantification of immunostaining for Six2/cleaved caspase-3 and Six2/pHH3 double-positive cells demonstrated no changes in apoptotic and proliferative status of Six2-positive nephron progenitors between control and DM_Exp kidneys (n = 5 litters from 4 different C57BL/6J control dams and n = 5 litters from 4 different Ins2+/C96Y dams and n = 4 litters from 4 different C57BL/6J control dams and n = 4 litters from 4 different Ins2+/C96Y dams, respectively). A Mann-Whitney test was used to determine statistical significance. Error bars represent SDs. *P ≤ 0.05. n.s., not significant.
Fig. 8.
Fig. 8.
The number of developing nephrons and expression of the Notch intracellular domain and lymphoid enhancer binding factor 1 (Lef1) are reduced in DM_Exp kidneys. A−H: immunofluorescence on kidney sections from male control and DM_Exp mice at postnatal day 2 (P2) using anti-Jagged1 (A and B), anti-Lef1 (C and D), anti-phosphorylated-β-catenin (p-β-cat) (E and F), and anti-total β-catenin (β-catenin) (G and H) antibodies (red). The ureteric bud and collecting duct system were visualized using fluorescein-labeled Dolichos biflorus agglutinin (DBA; green). The expression of Lef1 was reduced, whereas levels of phosphorylated-β-catenin were augmented, in DM_Exp kidneys. The expression of total β-catenin was unaltered. I and J: immunostaining for neural cell adhesion molecule (NCAM; green) and the intracellular domain of Notch1 (NICD1; red) demonstrated decreased Notch activity in nephron progenitors and developing nephrons in DM_Exp kidneys. Images shown are representative of three independent experiments (n = 3 male mice per condition derived from 3 different litters). Scale bar = 25 μm. K: Western blots demonstrating the expression of Jagged1 and phosphorylated-β-catenin in control and DM_Exp kidneys. Either GAPDH or β-tubulin was used as a loading control. Densitometric analyses of the bands on the Western blots shown in K demonstrated a trend toward reduced levels of Jagged1 (P = 0.0571) and increased levels of phosphorylated-β-catenin (P = 0.0571) in DM_Exp kidneys (bottom). L: semiquantitative analysis demonstrated a significant reduction of the number of Jagged1- and Lef1-positive structures in DM_Exp kidneys compared with control kidneys (n = 5 litters from 4 different C57BL/6J control dams and n = 5 litters from 4 different Ins2+/C96Y dams). M: quantitative PCR for ureteric bud markers (c-Ret and Wnt11) and the ureteric collecting system (Wnt9b) demonstrated no significant difference between control and DM_Exp kidneys (n = 5 litters from 4 different C57BL/6J control dams and n = 5 litters from 4 different Ins2+/C96Y dams). A Mann-Whitney test was used to determine statistical significance. Error bars represent SDs. *P ≤ 0.05. n.s., not significant.

Similar articles

Cited by

References

    1. Amri K, Freund N, Vilar J, Merlet-Bénichou C, Lelièvre-Pégorier M. Adverse effects of hyperglycemia on kidney development in rats: in vivo and in vitro studies. Diabetes 48: 2240–2245, 1999. doi:10.2337/diabetes.48.11.2240. - DOI - PubMed
    1. Barker DJ. Maternal nutrition, fetal nutrition, and disease in later life. Nutrition 13: 807–813, 1997. doi:10.1016/S0899-9007(97)00193-7. - DOI - PubMed
    1. Basu M, Zhu JY, LaHaye S, Majumdar U, Jiao K, Han Z, Garg V. Epigenetic mechanisms underlying maternal diabetes-associated risk of congenital heart disease. JCI Insight 2: 2 e95085, 2017. doi:10.1172/jci.insight.95085. - DOI - PMC - PubMed
    1. Behrens J, Jerchow BA, Würtele M, Grimm J, Asbrand C, Wirtz R, Kühl M, Wedlich D, Birchmeier W. Functional interaction of an axin homolog, conductin, with beta-catenin, APC, and GSK3beta. Science 280: 596–599, 1998. doi:10.1126/science.280.5363.596. - DOI - PubMed
    1. Boyle S, Shioda T, Perantoni AO, de Caestecker M. Cited1 and Cited2 are differentially expressed in the developing kidney but are not required for nephrogenesis. Dev Dyn 236: 2321–2330, 2007. doi:10.1002/dvdy.21242. - DOI - PubMed

Publication types