

Interactions between core histone marks and DNA methyltransferases predict DNA methylation patterns observed in human cells and tissues
- PMID: 31509087
- PMCID: PMC7028327
- DOI: 10.1080/15592294.2019.1666649
Interactions between core histone marks and DNA methyltransferases predict DNA methylation patterns observed in human cells and tissues
Abstract
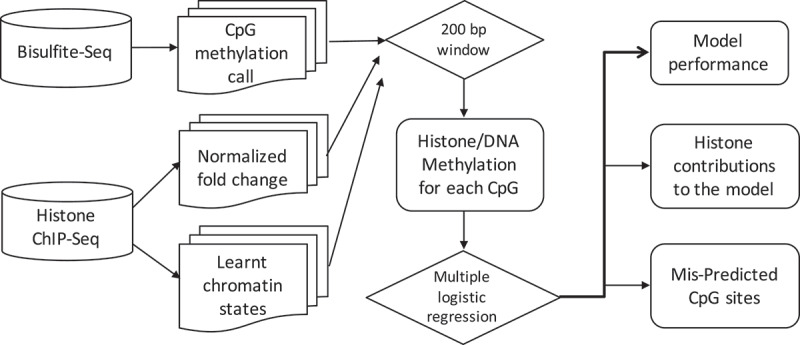
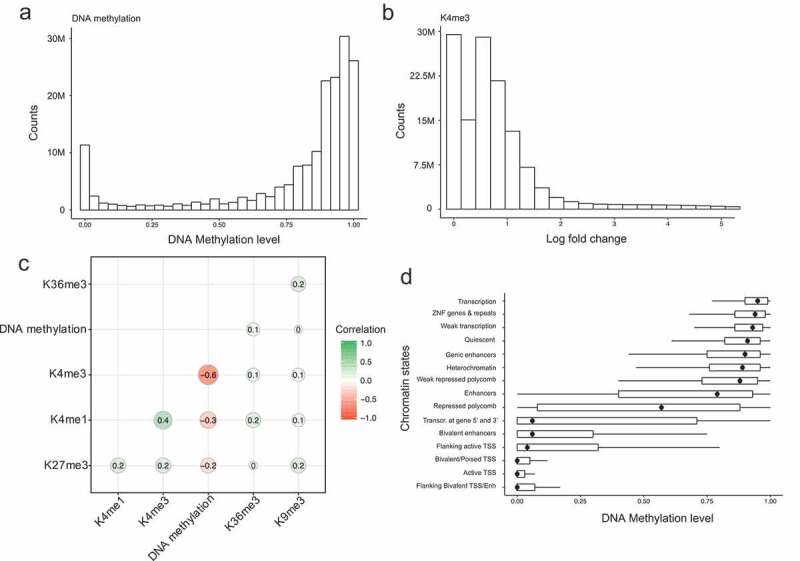
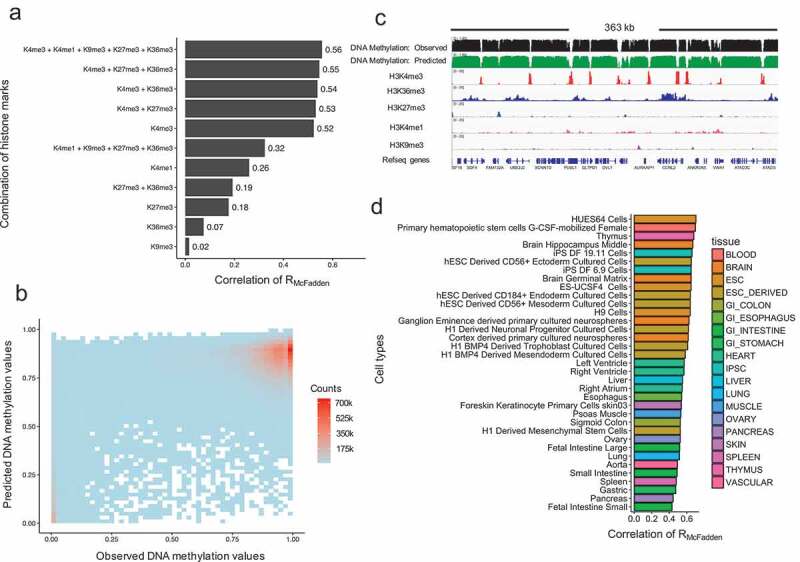
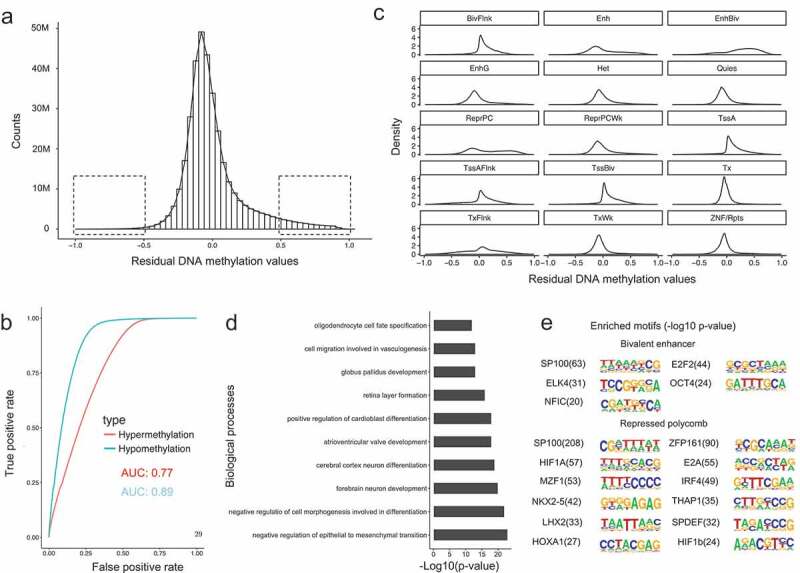
DNA methylation and histone modifications are two major epigenetic marks in mammalian cells. Previous studies have revealed that these two mechanisms interact although a quantitative model of these is still lacking in mammalian cells. Here we sought to develop such a model by systematically evaluating the quantitative relationship between DNA methylation and the core histone modification marks in human epigenomes. This model reflects the interactions of ADD and PWWP domains of DNA methyltransferase (DNMTs) with histone 3 lysine tails. Our analysis integrated 35 whole genome bisulphite sequencing data sets (about 800 million CpG sites), 35 chromatin states and 175 ChIP-Seq histone modification profiles across 35 human cell types. The logistic regression model we built shows that more than half of the variance across DNA methylomes can be explained by the five-core histone modification across varied types of human cell and tissue samples. Importantly, we find that H3K4me3 has a dramatic effect in DNA methylation patterning, highlighting the essential interaction between ADD domain of DNMTs and histone 3 lysine 4 in human. Moreover, our model suggests DNA methylation is generally inhibited by the presence of H3K4me3, H3K4me1 and H3K27me3, while increased levels are found in regions that are marked by H3K9me3 and H3K36me3. In summary, our results provide a comprehensive evaluation of the crosstalk between DNA methylation and histone modification in a variety of human cell types, and shows that DNA methylation patterns can be largely explained by interactions between histone 3 lysine tails and specific domains of DNA methyltransferases.
Keywords: DNA methylation imputation; Epigenetic interaction; epigenetic modelling.
Figures
Similar articles
-
Relationship between gene body DNA methylation and intragenic H3K9me3 and H3K36me3 chromatin marks.PLoS One. 2011 Apr 19;6(4):e18844. doi: 10.1371/journal.pone.0018844. PLoS One. 2011. PMID: 21526191 Free PMC article.
-
Identification of preferential target sites for human DNA methyltransferases.Nucleic Acids Res. 2011 Jan;39(1):104-18. doi: 10.1093/nar/gkq774. Epub 2010 Sep 13. Nucleic Acids Res. 2011. PMID: 20841325 Free PMC article.
-
Application of dual reading domains as novel reagents in chromatin biology reveals a new H3K9me3 and H3K36me2/3 bivalent chromatin state.Epigenetics Chromatin. 2017 Sep 25;10(1):45. doi: 10.1186/s13072-017-0153-1. Epigenetics Chromatin. 2017. PMID: 28946896 Free PMC article.
-
Molecular coupling of DNA methylation and histone methylation.Epigenomics. 2010 Oct;2(5):657-69. doi: 10.2217/epi.10.44. Epigenomics. 2010. PMID: 21339843 Free PMC article. Review.
-
Regulation of maintenance DNA methylation via histone ubiquitylation.J Biochem. 2016 Jan;159(1):9-15. doi: 10.1093/jb/mvv113. Epub 2015 Nov 20. J Biochem. 2016. PMID: 26590302 Free PMC article. Review.
Cited by
-
The interplay between DNA and histone methylation: molecular mechanisms and disease implications.EMBO Rep. 2021 May 5;22(5):e51803. doi: 10.15252/embr.202051803. Epub 2021 Apr 12. EMBO Rep. 2021. PMID: 33844406 Free PMC article. Review.
-
Dynamic Regulation of DNA Methylation and Brain Functions.Biology (Basel). 2023 Jan 18;12(2):152. doi: 10.3390/biology12020152. Biology (Basel). 2023. PMID: 36829430 Free PMC article. Review.
-
The landscape of Chlamydomonas histone H3 lysine 4 methylation reveals both constant features and dynamic changes during the diurnal cycle.Plant J. 2022 Oct;112(2):352-368. doi: 10.1111/tpj.15948. Epub 2022 Sep 20. Plant J. 2022. PMID: 35986497 Free PMC article.
-
The H3.3 K36M oncohistone disrupts the establishment of epigenetic memory through loss of DNA methylation.bioRxiv [Preprint]. 2023 Oct 14:2023.10.13.562147. doi: 10.1101/2023.10.13.562147. bioRxiv. 2023. Update in: Mol Cell. 2024 Oct 17;84(20):3899-3915.e7. doi: 10.1016/j.molcel.2024.09.015. PMID: 37873347 Free PMC article. Updated. Preprint.
-
Comprehensive analysis of H3K27me3 LOCKs under different DNA methylation contexts reveal epigenetic redistribution in tumorigenesis.Epigenetics Chromatin. 2025 Jan 20;18(1):6. doi: 10.1186/s13072-025-00570-0. Epigenetics Chromatin. 2025. PMID: 39833880 Free PMC article.
References
Publication types
MeSH terms
Substances
LinkOut - more resources
Full Text Sources
Other Literature Sources