. 2020 Jan 1;29(1):1-19.
doi: 10.1093/hmg/ddz215.

Individualized management of genetic diversity in Niemann-Pick C1 through modulation of the Hsp70 chaperone system

Affiliations

Individualized management of genetic diversity in Niemann-Pick C1 through modulation of the Hsp70 chaperone system

Chao Wang et al. Hum Mol Genet. .

Abstract

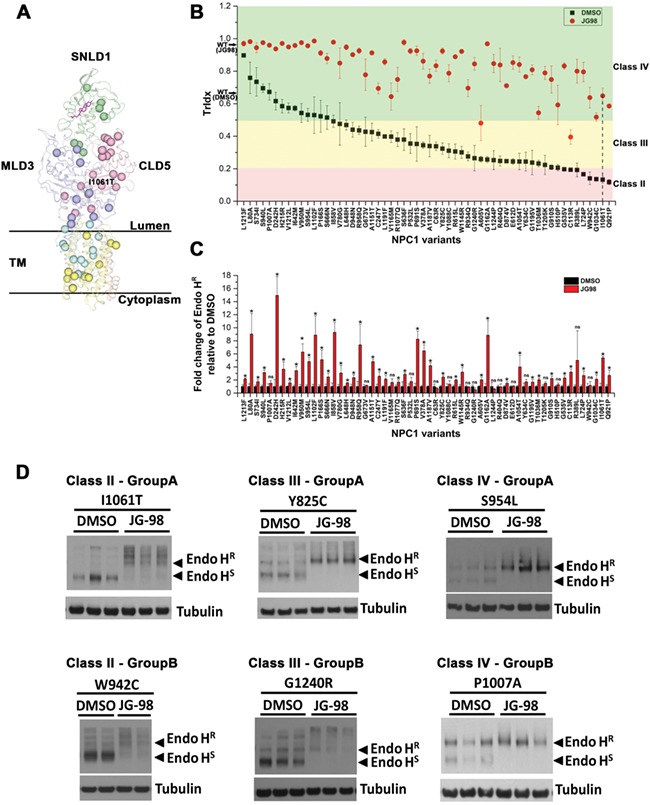
Genetic diversity provides a rich repository for understanding the role of proteostasis in the management of the protein fold in human biology. Failure in proteostasis can trigger multiple disease states, affecting both human health and lifespan. Niemann-Pick C1 (NPC1) disease is a rare genetic disorder triggered by mutations in NPC1, a multi-spanning transmembrane protein that is trafficked through the exocytic pathway to late endosomes (LE) and lysosomes (Ly) (LE/Ly) to globally manage cholesterol homeostasis. Defects triggered by >300 NPC1 variants found in the human population inhibit export of NPC1 protein from the endoplasmic reticulum (ER) and/or function in downstream LE/Ly, leading to cholesterol accumulation and onset of neurodegeneration in childhood. We now show that the allosteric inhibitor JG98, that targets the cytosolic Hsp70 chaperone/co-chaperone complex, can significantly improve the trafficking and post-ER protein level of diverse NPC1 variants. Using a new approach to model genetic diversity in human disease, referred to as variation spatial profiling, we show quantitatively how JG98 alters the Hsp70 chaperone/co-chaperone system to adjust the spatial covariance (SCV) tolerance and set-points on an amino acid residue-by-residue basis in NPC1 to differentially regulate variant trafficking, stability, and cholesterol homeostasis, results consistent with the role of BCL2-associated athanogene family co-chaperones in managing the folding status of NPC1 variants. We propose that targeting the cytosolic Hsp70 system by allosteric regulation of its chaperone/co-chaperone based client relationships can be used to adjust the SCV tolerance of proteostasis buffering capacity to provide an approach to mitigate systemic and neurological disease in the NPC1 population.


Figures

Figure 1
Figure 1
The impact of Hsp70 allosteric inhibitors on the trafficking and stability of NPC1-I1061T. (A) Domains in the NPC1 protein. (B–D) A series of Hsp70 allosteric inhibitors were tested in U2OS-SRA-shNPC1 cells transfected with NPC1-I1061T. All sample lysates were treated with Endo H and analyzed by SDS-PAGE. The slower migrating band is the Endo HR species representative of the post-ER glycoform of NPC1 protein. The faster migrating band is Endo HS species representative of the immature glycoform of NPC1 protein located in the ER. (E) Quantification of Western-blot results in B–D. TrIdx (left panel) is calculated as Endo HR/(Endo HR + Endo HS) defining the trafficking efficiency of NPC1-I1061T. Fold-change of Endo HR relative to DMSO after JG98 treatment (right panel) represents the change of protein level of the post-ER glycoforms of NPC1 after compound treatment reported as a specific activity of the total μg protein loaded on the gel.
Figure 2
Figure 2
Impact of JG98 on NPC1 patient fibroblasts. (A) JG98 was tested on a collection of fibroblasts from patients with different NPC1 genotypes (see Methods). NPC1 was immunoprecipitated from 75 μg of total cell lysate protein, treated with Endo H, eluted from anti-NPC1 beads and separated on a 4–12% Bis-Tris SDS-PAGE. (B) Quantification of TrIdx (left panel) for each fibroblast. Four fibroblasts were tested in triplicates and 1 fibroblast was tested in duplicate. The associated error bar (mean ± SD) and P-value (P < 0.05,*; P > 0.05, ns; Student’s t-test) are indicated. The remaining 14 fibroblasts are reported as singlets. Fibroblasts with different NPC1 genotypes are ordered according to their TrIdx value in DMSO condition. Right panel shows a box and whisker plot for the TrIdx of all the fibroblasts in the DMSO and JG98 condition. P-value (Student’s t-test) is indicated. (C) Quantification of the fold-change of Endo HR species relative to DMSO (left panel). Fibroblasts with different genotypes are arranged according to the fold-change in Endo HR species relative to DMSO. For the fibroblasts that have experimental replicates, error bar (mean ± SD) and P-value (P < 0.05,*; P > 0.05, ns; Student’s t-test) are indicated. Right panel shows a box and whisker plot for the normalized Endo HR species relative to the WT standard run in each gel. P-value (Student’s t-test) is indicated. (D) Analysis of impact of 0.125, 0.25, 0.5, and 1.0 μm JG98 for 24 h fibroblast I1061T/I1061T genotype in duplicate. (E) Quantification of TrIdx (left panel) and the fold change of Endo HR relative to DMSO with JG98 treatment (right panel) for the dose experiment shown in (D) (mean ± SD).
Figure 3
Figure 3
Impact of JG98 on the trafficking and stability of 58 NPC1 variants expressed in U2OS cells. (A) 58 NPC1 variants used in this study are showed as balls in NPC1 structure (. Each domain is labeled. Cholesterol is shown as a stick figure in magenta. (B) Quantification of the TrIdx for all the 58 variants in the absence (black squares) or presence (red circles) of JG98. Error bar is indicated as mean ± SD. Plasmid harboring each of the 58 variants was transfected in U2OS-SRA-shNPC1 cells. After treatment of 5 μm JG98 for 24 h, all sample lysates were treated with Endo H followed by Western blotting. Variants are ordered according to their TrIdx in the DMSO condition. Variants are grouped into different classes based on their TrIdx as indicated by background color (pink—Class II, yellow—Class III, green—Class IV). The P-value associated with each variant when compared with the JG98 treated or untreated condition was <0.05 (Student’s t-test). (C) Quantification of the fold-change of Endo HR relative to DMSO after treatment of JG98 (mean ± SD). Variants are in the same order as (B). P-value for each variant compared with JG98 treated and untreated groups are labeled (P < 0.05,*; P > 0.05, ns; Student’s t-test). (D) Examples of Immunoblots for variants with increased Endo HR (Group A) or no significant change of Endo HR (Group B) in each TrIdx class are shown.
Figure 4
Figure 4
Mapping JG98 impact across the entire NPC1 polypeptide using VSP. (A) By analyzing the SCV relationships of 58 NPC1 variants according to their position in primary sequence (x-axis), TrIdx value in DMSO (y-axis) and delta (∆) TrIdx response to JG98 (upper panel), VSP ( constructs a phenotype landscape (lower panel) that maps delta (∆) TrIdx response for all the residues across the entire NPC1 polypeptide. Color scale shows the predicted delta (∆) TrIdx values with red-orange representing no response, yellow-green representing a low to medium response and blue-cyan representing a high response. Contour lines represent the confidence for the delta (∆) TrIdx response prediction with the top 25% confident region highlighted by bold contour lines (. (B) The phenotype landscape can be mapped to a structure snapshot of NPC1 ( to show the specific structural features of NPC1 fold that JG98 targets. (C) The top 40% predicted TrIdx responsive regions to JG98 are highlighted by assigning the color for all regions below the 40% threshold TrIdx as gray. (D–F) VSP predicts the phenotype landscape for the absolute Endo HR changes in response to JG98 (D). Log2 transformation of the fold change of Endo HR after JG98 treatment is used as input for VSP training (upper panel) to generate the phenotype landscape (lower panel). The phenotype landscape is mapped onto structure (E). (F) The top 30% predicted Endo HR responsive regions to JG98 are highlighted by assigning the color for all regions below the 30% threshold of Endo HR response as gray.
Figure 5
Figure 5
Impact of Hsp70 co-chaperone BAG proteins on NPC1-I1061T. (A) Immunoblot analysis Endo H digestion products of NPC1-I1061T after partial silencing of BAGs 1–3 with siRNA. (B) Quantification of (A) for TrIdx (left panel) and fold-change of Endo HR relative to scramble siRNA control (right panel). The error bar (mean ± SD) and P-value (P < 0.05, *; P > 0.05, ns; Student’s t-test) are indicated. (C) Cartoon description of WT and modified BAG1–3 plasmids used for overexpression analysis. BAG1 has a deletion at ΔC44 which creates a truncated form of the protein with the BAG domain disrupted. Similarly, BAG3 has a deletion at ΔC450 which creates a BAG domain truncated form of the protein. (D and E) Immunoblot analysis (D) and quantitation (E) of Endo H digested products of NPC1-I1061T in response to overexpression of BAG proteins described in (C).
Figure 6
Figure 6
Impact of JG98 on SREBP-2 pathway in homozygous I1061T patient fibroblast. (A) Immunoblot analysis of SREBP-2 in WT/WT and I1061T/I1061T fibroblasts with or without JG98. The p-SREBP-2 and m-SREBP-2 are labeled. (B) Quantification of (A) for total SREBP-2 (p-SREBP-2 plus m-SREBP-2) (left panel) and m-SREBP-2 (right panel). The error bar (mean ± SD) and P-value (P < 0.05, *; P < 0.01, **; Student’s t-test) are indicated. (C–F) mRNA expression measured by real-time PCR for SREBP-2 (C), LDLR (D), HMGCoA S (E) and HMGCoA R (F) in WT/WT and I1061T/I1061T fibroblast with and without JG98. 18 s mRNA was used as an internal housekeeping control. The error bar (mean ± SD) and P-value (P < 0.05, *; P < 0.01, **; P < 0.001,***; Student’s t-test) are indicated.

Similar articles

Cited by

References

    1. Wang C. and Balch W.E. (2018) Bridging genomics to phenomics at atomic resolution through variation spatial profiling. Cell Rep., 24(2013–2028), e2016. - PMC - PubMed
    1. Hindorff L.A., Bonham V.L., Brody L.C., Ginoza M.E.C., Hutter C.M., Manolio T.A. and Green E.D. (2018) Prioritizing diversity in human genomics research. Nat. Rev. Genet., 19, 175–185. - PMC - PubMed
    1. Torkamani A., Andersen K.G., Steinhubl S.R. and Topol E.J. (2017) High-definition medicine. Cell, 170, 828–843. - PMC - PubMed
    1. Torkamani A., Wineinger N.E. and Topol E.J. (2018) The personal and clinical utility of polygenic risk scores. Nat. Rev. Genet., 19, 581–590. - PubMed
    1. Shendure J., Findlay G.M. and Snyder M.W. (2019) Genomic medicine-progress, pitfalls, and promise. Cell, 177, 45–57. - PMC - PubMed

Publication types

MeSH terms