

Data-driven identification of subtypes of executive function across typical development, attention deficit hyperactivity disorder, and autism spectrum disorders
- PMID: 31509248
- PMCID: PMC6906253
- DOI: 10.1111/jcpp.13114
Data-driven identification of subtypes of executive function across typical development, attention deficit hyperactivity disorder, and autism spectrum disorders
Abstract
Background: Impairment of executive function (EF), the goal-directed regulation of thoughts, actions, and emotions, drives negative outcomes and is common across neurodevelopmental disorders including attention deficit hyperactivity disorder (ADHD) and autism spectrum disorder (ASD). A primary challenge to its amelioration is heterogeneity in symptom expression within and across disorders. Parsing this heterogeneity is necessary to attain diagnostic precision, a goal of the NIMH Research Domain Criteria Initiative. We aimed to identify transdiagnostic subtypes of EF that span the normal to impaired spectrum and establish their predictive and neurobiological validity.
Methods: Community detection was applied to clinical parent-report measures in 8-14-year-old children with and without ADHD and ASD from two independent cohorts (discovery N = 320; replication N = 692) to identify subgroups with distinct behavioral profiles. Support vector machine (SVM) classification was used to predict subgroup membership of unseen cases. Preliminary neurobiological validation was obtained with existing functional magnetic resonance imaging (fMRI) data on a subsample (N = 84) by testing hypotheses about sensitivity of EF subgroups versus DSM categories.
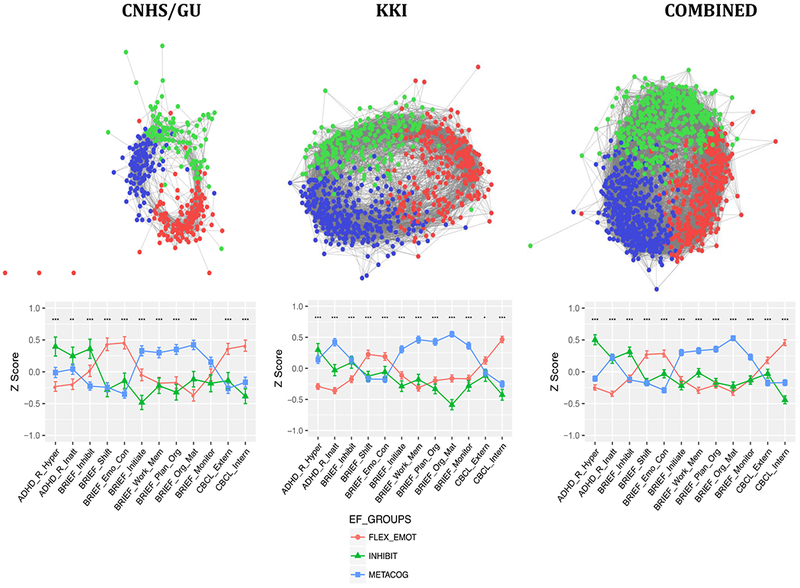
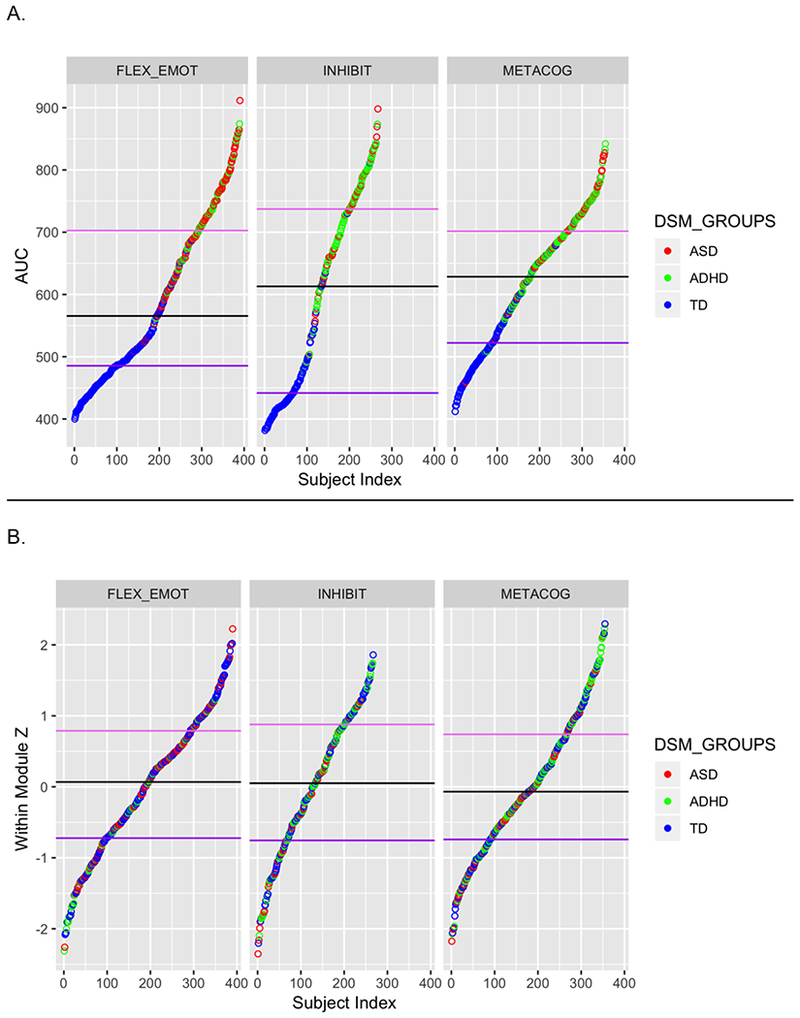
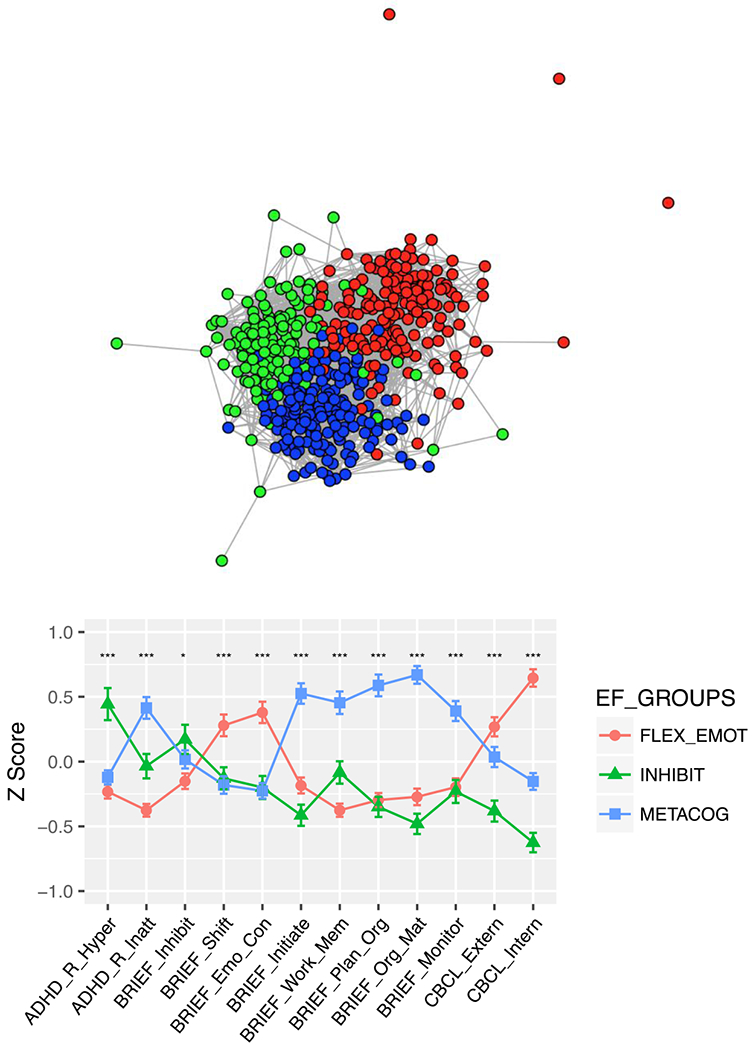
Results: We observed three transdiagnostic EF subtypes characterized by behavioral profiles that were defined by relative weakness in: (a) flexibility and emotion regulation; (b) inhibition; and (c) working memory, organization, and planning. The same tripartite structure was also present in the typically developing children. SVM trained on the discovery sample and tested on the replication sample classified subgroup membership with 77.0% accuracy. Split-half SVM classification on the combined sample (N = 1,012) yielded 88.9% accuracy (this SVM is available for public use). As hypothesized, frontal-parietal engagement was better distinguished by EF subtype than DSM diagnosis and the subgroup characterized with inflexibility failed to modulate right IPL activation in response to increased executive demands.
Conclusions: The observed transdiagnostic subtypes refine current diagnostic nosology and augment clinical decision-making for personalizing treatment of executive dysfunction in children.
Keywords: Attention deficit hyperactivity disorder; autism spectrum disorders; functional MRI (fMRI); individual differences; machine learning.
© 2019 Association for Child and Adolescent Mental Health.
Conflict of interest statement
Figures

Similar articles
-
Executive function predicts the visuospatial working memory in autism spectrum disorder and attention-deficit/hyperactivity disorder.Autism Res. 2018 Aug;11(8):1148-1156. doi: 10.1002/aur.1967. Epub 2018 Aug 10. Autism Res. 2018. PMID: 30095242
-
Heterogeneity of executive function revealed by a functional random forest approach across ADHD and ASD.Neuroimage Clin. 2020;26:102245. doi: 10.1016/j.nicl.2020.102245. Epub 2020 Mar 16. Neuroimage Clin. 2020. PMID: 32217469 Free PMC article.
-
Autism spectrum disorder polygenic scores are associated with every day executive function in children admitted for clinical assessment.Autism Res. 2020 Feb;13(2):207-220. doi: 10.1002/aur.2207. Epub 2019 Sep 30. Autism Res. 2020. PMID: 31571410 Free PMC article.
-
Infant regulatory function acts as a protective factor for later traits of autism spectrum disorder and attention deficit/hyperactivity disorder but not callous unemotional traits.J Neurodev Disord. 2019 Jul 18;11(1):14. doi: 10.1186/s11689-019-9274-0. J Neurodev Disord. 2019. PMID: 31351456 Free PMC article. Review.
-
Do ASD and ADHD Have Distinct Executive Function Deficits? A Systematic Review and Meta-Analysis of Direct Comparison Studies.J Atten Disord. 2023 Dec;27(14):1571-1582. doi: 10.1177/10870547231190494. Epub 2023 Aug 11. J Atten Disord. 2023. PMID: 37565325 Free PMC article.
Cited by
-
Comorbidity of Attention-Deficit Hyperactivity Disorder and Autism Spectrum Disorders: Current Status and Promising Directions.Curr Top Behav Neurosci. 2022;57:159-177. doi: 10.1007/7854_2022_334. Curr Top Behav Neurosci. 2022. PMID: 35397063
-
Visual attention and inhibitory control in children, teenagers and adults with autism without intellectual disability: results of oculomotor tasks from a 2-year longitudinal follow-up study (InFoR).Mol Autism. 2021 Nov 13;12(1):71. doi: 10.1186/s13229-021-00474-2. Mol Autism. 2021. PMID: 34774105 Free PMC article.
-
TSP-GNN: a novel neuropsychiatric disorder classification framework based on task-specific prior knowledge and graph neural network.Front Neurosci. 2023 Dec 21;17:1288882. doi: 10.3389/fnins.2023.1288882. eCollection 2023. Front Neurosci. 2023. PMID: 38188031 Free PMC article.
-
Understanding patterns of heterogeneity in executive functioning during adolescence: Evidence from population-level data.Dev Sci. 2022 Nov;25(6):e13256. doi: 10.1111/desc.13256. Epub 2022 Mar 11. Dev Sci. 2022. PMID: 35238432 Free PMC article.
-
Improving Executive Functions Using the Engineering Design Process: A Peer-Mediated Problem-Solving Approach for Autistic Adolescents.Am J Occup Ther. 2023 Mar 1;77(2):7702347010. doi: 10.5014/ajot.2023.050166. Am J Occup Ther. 2023. PMID: 37018053 Free PMC article.
References
-
- Achenbach TM (2009). The Achenbach System of Empirically Based Assessemnt (ASEBA): Development, Findings, Theory, and Applications. Burlington, VT: University of Vermont Research Center for Children, Youth, & Families.
-
- American, Psychological, & Association. (2013). Diagnostic and statistical manual of mental disorders (5th ed.). Washington, DC.
Publication types
MeSH terms
Grants and funding
LinkOut - more resources
Full Text Sources
Other Literature Sources
Medical
Research Materials
