

Endurance exercise leads to beneficial molecular and physiological effects in a mouse model of myotonic dystrophy type 1
- PMID: 31509256
- PMCID: PMC7026901
- DOI: 10.1002/mus.26709
Endurance exercise leads to beneficial molecular and physiological effects in a mouse model of myotonic dystrophy type 1
Abstract
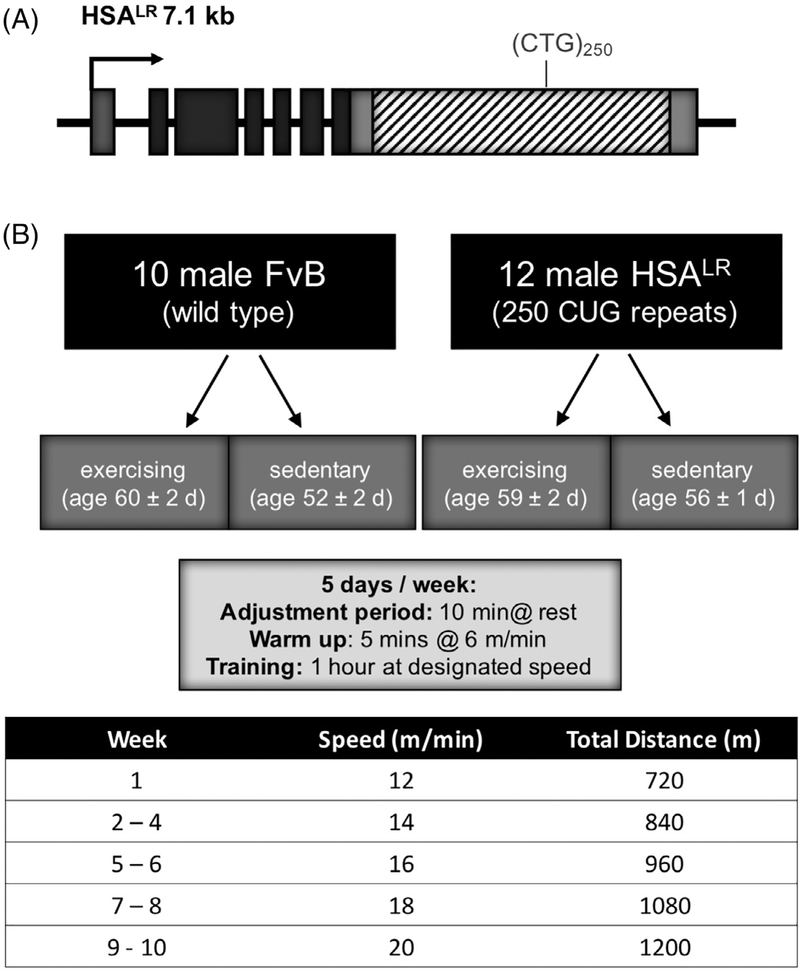
Introduction: Myotonic dystrophy type 1 (DM1) is a multisystemic disease caused by expansion of a CTG repeat in the 3' UTR of the Dystrophia Myotonica-Protein Kinase (DMPK) gene. While multiple organs are affected, more than half of mortality is due to muscle wasting.
Methods: It is unclear whether endurance exercise provides beneficial effects in DM1. Here, we show that a 10-week treadmill endurance exercise program leads to beneficial effects in the HSALR mouse model of DM1.
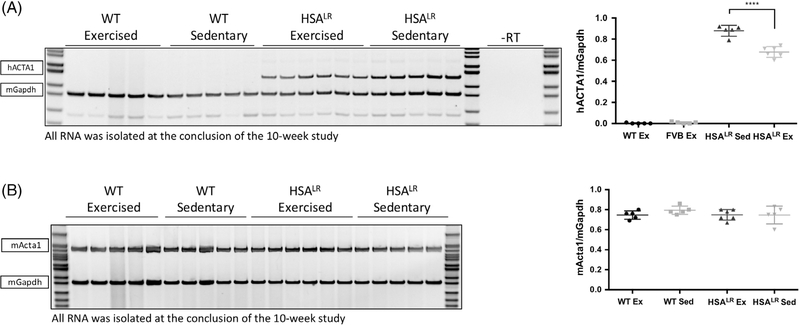
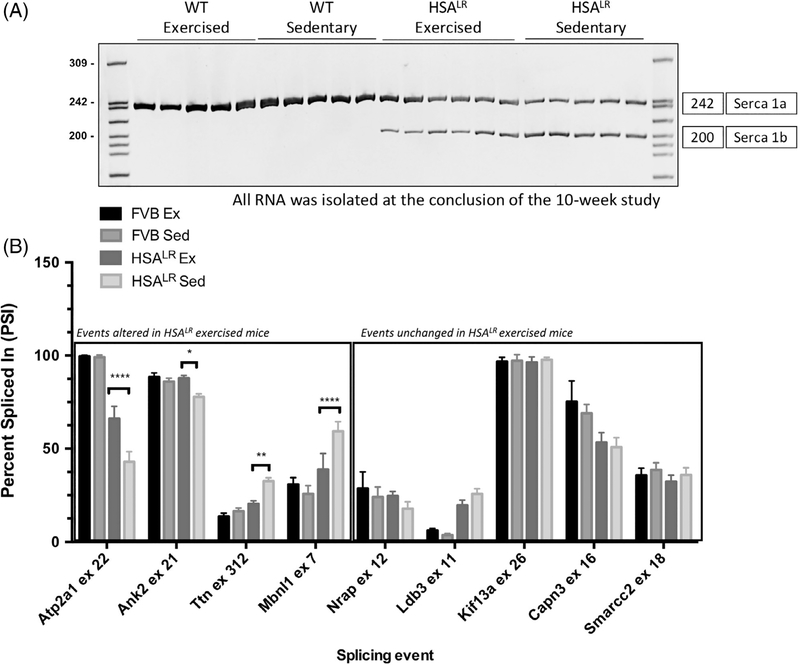
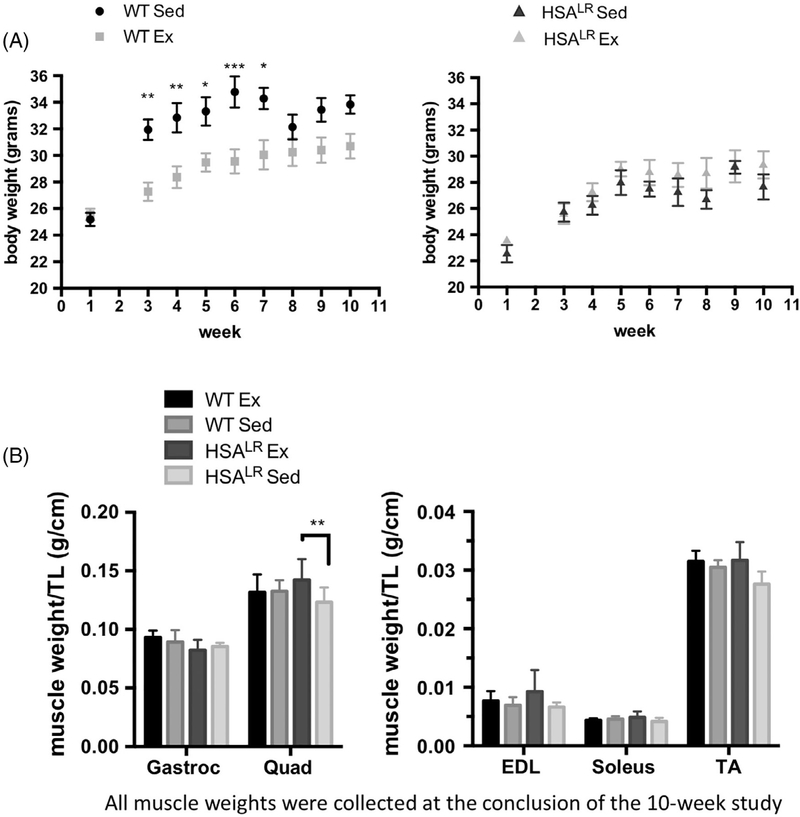
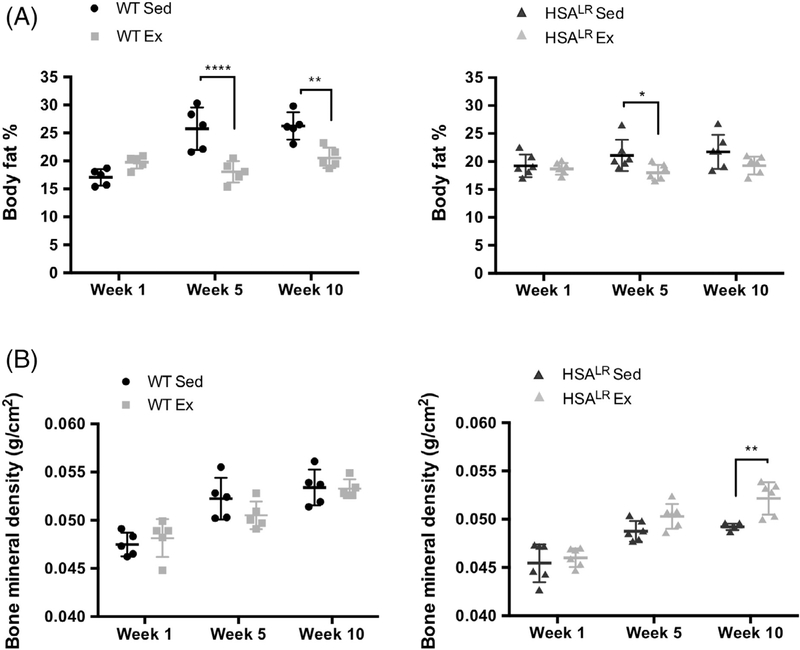
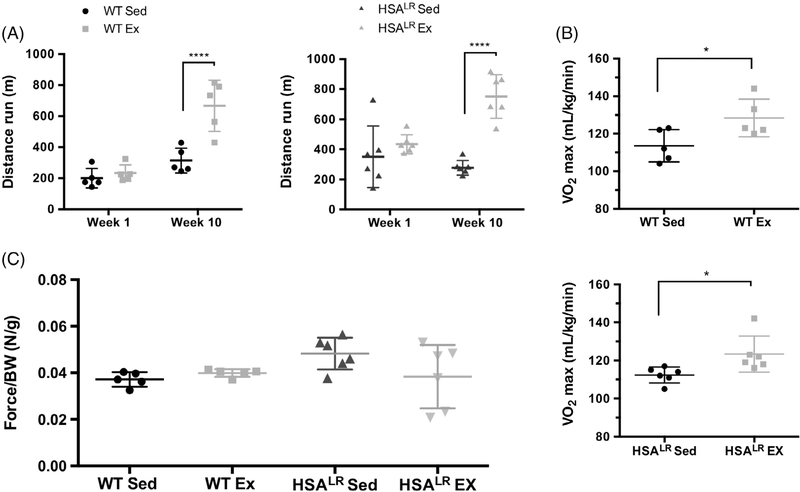
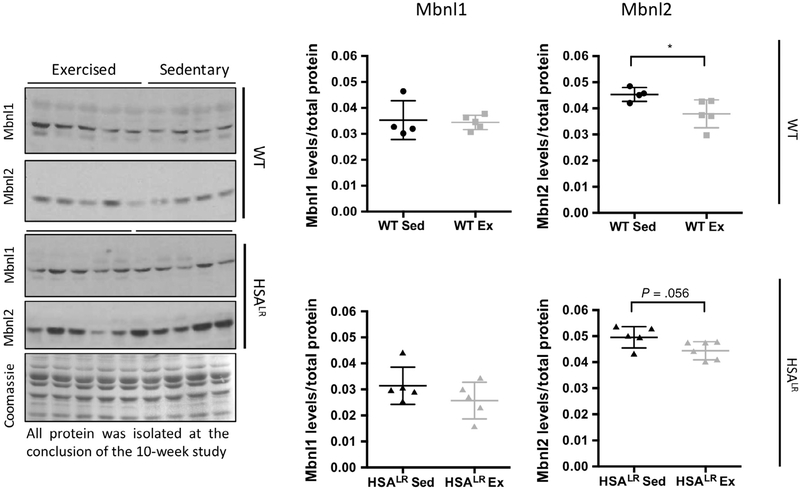
Results: Animals that performed treadmill training displayed reduced CUGexp RNA levels, improved splicing abnormalities, an increase in skeletal muscle weight and improved endurance capacity.
Discussion: These results indicate that endurance exercise does not have adverse effects in HSALR animals and contributes to beneficial molecular and physiological outcomes.
Keywords: endurance exercise; mouse model; myotonic dystrophy type I; skeletal muscle; splicing; treadmill.
© 2019 Wiley Periodicals, Inc.
Conflict of interest statement
CONFLICT OF INTEREST
None of the authors has any conflict of interest to disclose.
Figures
Similar articles
-
Chronic exercise mitigates disease mechanisms and improves muscle function in myotonic dystrophy type 1 mice.J Physiol. 2019 Mar;597(5):1361-1381. doi: 10.1113/JP277123. Epub 2019 Jan 30. J Physiol. 2019. PMID: 30628727 Free PMC article.
-
A low absolute number of expanded transcripts is involved in myotonic dystrophy type 1 manifestation in muscle.Hum Mol Genet. 2016 Apr 15;25(8):1648-62. doi: 10.1093/hmg/ddw042. Epub 2016 Feb 16. Hum Mol Genet. 2016. PMID: 26908607 Free PMC article.
-
Aberrantly spliced alpha-dystrobrevin alters alpha-syntrophin binding in myotonic dystrophy type 1.Neurology. 2008 Feb 26;70(9):677-85. doi: 10.1212/01.wnl.0000302174.08951.cf. Neurology. 2008. PMID: 18299519
-
Myotonic dystrophy: clinical and molecular parallels between myotonic dystrophy type 1 and type 2.Curr Neurol Neurosci Rep. 2002 Sep;2(5):465-70. doi: 10.1007/s11910-002-0074-6. Curr Neurol Neurosci Rep. 2002. PMID: 12169228 Review.
-
RNA pathogenesis of the myotonic dystrophies.Neuromuscul Disord. 2005 Jan;15(1):5-16. doi: 10.1016/j.nmd.2004.09.012. Epub 2004 Nov 26. Neuromuscul Disord. 2005. PMID: 15639115 Review.
Cited by
-
Effect of exercise training on clinical and physiological variables in adults with myotonic dystrophy type 1: A systematic review protocol.MethodsX. 2024 Sep 12;13:102957. doi: 10.1016/j.mex.2024.102957. eCollection 2024 Dec. MethodsX. 2024. PMID: 39376683 Free PMC article.
-
Use of HSALR female mice as a model for the study of myotonic dystrophy type I.Lab Anim (NY). 2025 Apr;54(4):92-102. doi: 10.1038/s41684-025-01506-7. Epub 2025 Feb 27. Lab Anim (NY). 2025. PMID: 40016516 Free PMC article.
-
Alternative splicing dysregulation across tissue and therapeutic approaches in a mouse model of myotonic dystrophy type 1.Mol Ther Nucleic Acids. 2024 Sep 13;35(4):102338. doi: 10.1016/j.omtn.2024.102338. eCollection 2024 Dec 10. Mol Ther Nucleic Acids. 2024. PMID: 39391766 Free PMC article.
-
Benefits of aerobic exercise in myotonic dystrophy type 1.J Clin Invest. 2022 May 16;132(10):e160229. doi: 10.1172/JCI160229. J Clin Invest. 2022. PMID: 35575095 Free PMC article.
-
Individual transcriptomic response to strength training for patients with myotonic dystrophy type 1.JCI Insight. 2023 Jul 24;8(14):e163856. doi: 10.1172/jci.insight.163856. JCI Insight. 2023. PMID: 37318869 Free PMC article.
References
Publication types
MeSH terms
Substances
Grants and funding
LinkOut - more resources
Full Text Sources
