

Exercise Degrades Bone in Caloric Restriction, Despite Suppression of Marrow Adipose Tissue (MAT)
- PMID: 31509274
- PMCID: PMC6980282
- DOI: 10.1002/jbmr.3872
Exercise Degrades Bone in Caloric Restriction, Despite Suppression of Marrow Adipose Tissue (MAT)
Abstract
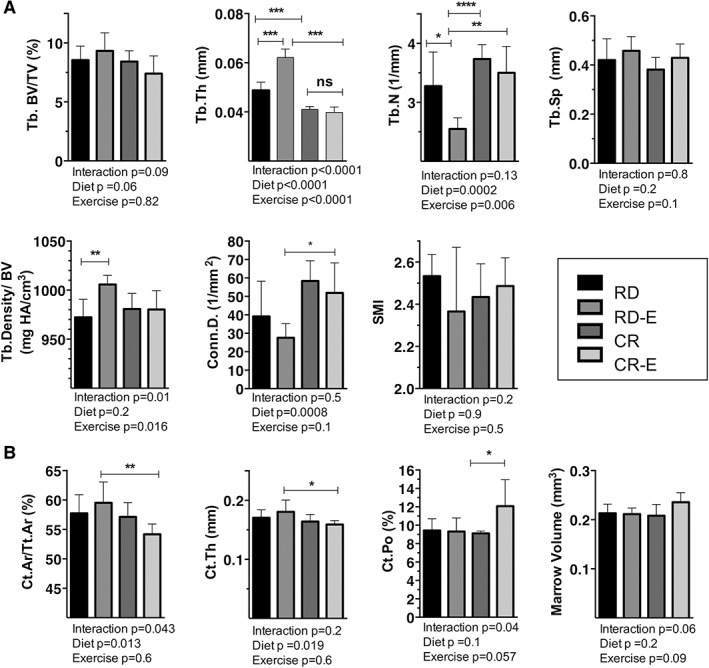
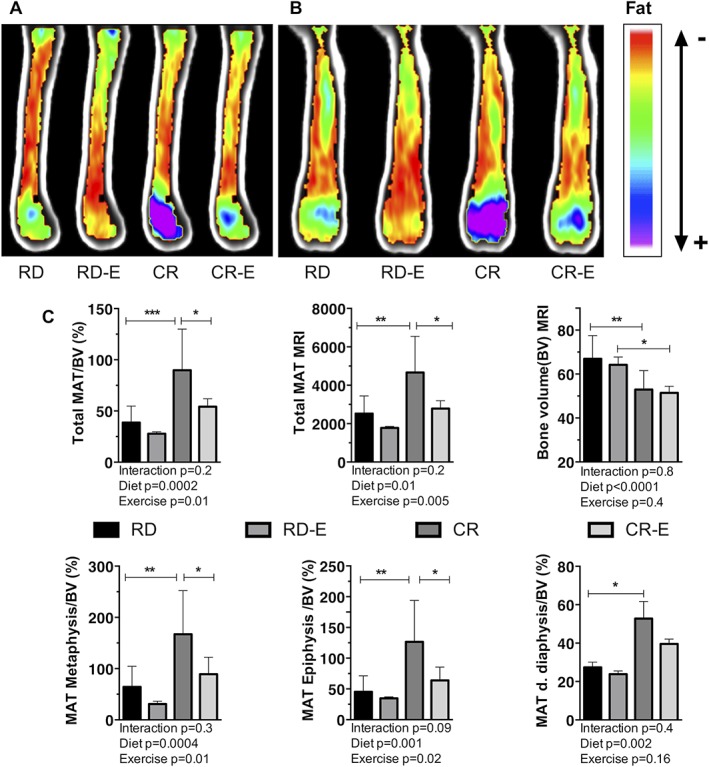
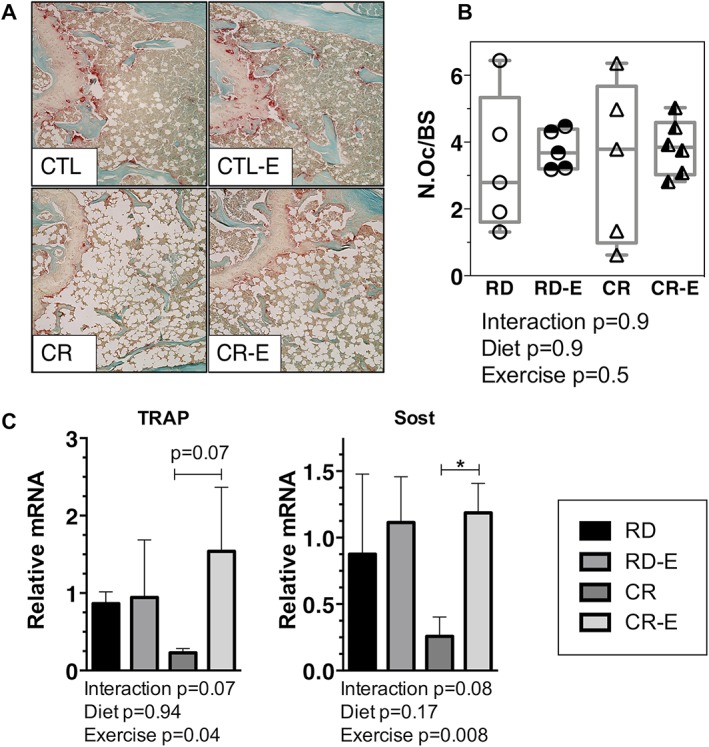
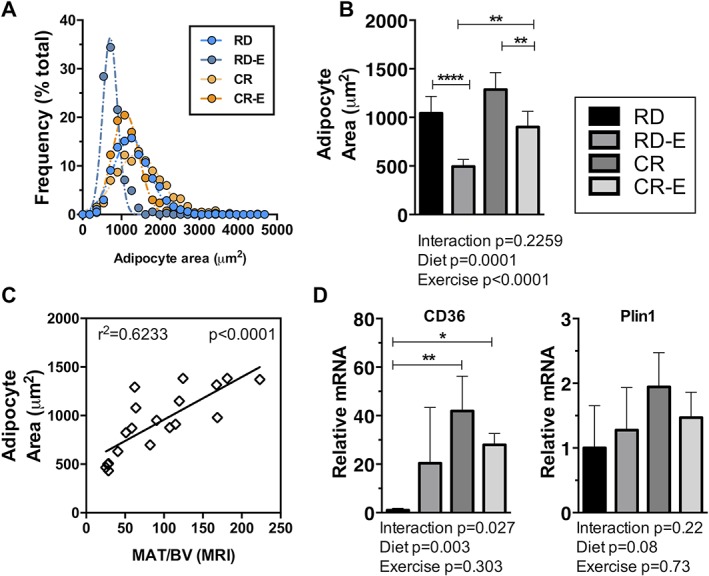
Marrow adipose tissue (MAT) and its relevance to skeletal health during caloric restriction (CR) is unknown: It remains unclear whether exercise, which is anabolic to bone in a calorie-replete state, alters bone or MAT in CR. We hypothesized that response of bone and MAT to exercise in CR differs from the calorie-replete state. Ten-week-old female B6 mice fed a regular diet (RD) or 30% CR diet were allocated to sedentary (RD, CR, n = 10/group) or running exercise (RD-E, CR-E, n = 7/group). After 6 weeks, CR mice weighed 20% less than RD, p < 0.001; exercise did not affect weight. Femoral bone volume (BV) via 3D MRI was 20% lower in CR versus RD (p < 0.0001). CR was associated with decreased bone by μCT: Tb.Th was 16% less in CR versus RD, p < 0.003, Ct.Th was 5% less, p < 0.07. In CR-E, Tb.Th was 40% less than RD-E, p < 0.0001. Exercise increased Tb.Th in RD (+23% RD-E versus RD, p < 0.003) but failed to do so in CR. Cortical porosity increased after exercise in CR (+28%, p = 0.04), suggesting exercise during CR is deleterious to bone. In terms of bone fat, metaphyseal MAT/ BV rose 159% in CR versus RD, p = 0.003 via 3D MRI. Exercise decreased MAT/BV by 52% in RD, p < 0.05, and also suppressed MAT in CR (-121%, p = 0.047). Histomorphometric analysis of adipocyte area correlated with MAT by MRI (R2 = 0.6233, p < 0.0001). With respect to bone, TRAP and Sost mRNA were reduced in CR. Intriguingly, the repressed Sost in CR rose with exercise and may underlie the failure of CR-bone quantity to increase in response to exercise. Notably, CD36, a marker of fatty acid uptake, rose 4088% in CR (p < 0.01 versus RD), suggesting that basal increases in MAT during calorie restriction serve to supply local energy needs and are depleted during exercise with a negative impact on bone. © 2019 The Authors. Journal of Bone and Mineral Research published by American Society for Bone and Mineral Research.
Keywords: BONE-FAT INTERACTIONS; EXERCISE; MARROW ADIPOSE TISSUE (MAT).
© 2019 The Authors. Journal of Bone and Mineral Research published by American Society for Bone and Mineral Research.
Figures

Similar articles
-
Exercise Decreases Marrow Adipose Tissue Through ß-Oxidation in Obese Running Mice.J Bone Miner Res. 2017 Aug;32(8):1692-1702. doi: 10.1002/jbmr.3159. Epub 2017 May 4. J Bone Miner Res. 2017. PMID: 28436105 Free PMC article.
-
Daily leptin blunts marrow fat but does not impact bone mass in calorie-restricted mice.J Endocrinol. 2016 Jun;229(3):295-306. doi: 10.1530/JOE-15-0473. J Endocrinol. 2016. PMID: 27340200 Free PMC article.
-
Bone marrow fat accumulation accelerated by high fat diet is suppressed by exercise.Bone. 2014 Jul;64:39-46. doi: 10.1016/j.bone.2014.03.044. Epub 2014 Apr 5. Bone. 2014. PMID: 24709686 Free PMC article.
-
Exercise Regulation of Marrow Adipose Tissue.Front Endocrinol (Lausanne). 2016 Jul 14;7:94. doi: 10.3389/fendo.2016.00094. eCollection 2016. Front Endocrinol (Lausanne). 2016. PMID: 27471493 Free PMC article. Review.
-
Bone Marrow Adipose Tissue Quantification by Imaging.Curr Osteoporos Rep. 2019 Dec;17(6):416-428. doi: 10.1007/s11914-019-00539-5. Curr Osteoporos Rep. 2019. PMID: 31713178 Review.
Cited by
-
Exercise Increases Bone in SEIPIN Deficient Lipodystrophy, Despite Low Marrow Adiposity.Front Endocrinol (Lausanne). 2022 Jan 25;12:782194. doi: 10.3389/fendo.2021.782194. eCollection 2021. Front Endocrinol (Lausanne). 2022. PMID: 35145475 Free PMC article.
-
Diet-Stimulated Marrow Adiposity Fails to Worsen Early, Age-Related Bone Loss.Obes Facts. 2024;17(2):145-157. doi: 10.1159/000536159. Epub 2024 Jan 15. Obes Facts. 2024. PMID: 38224679 Free PMC article.
-
The Effects of Different Dietary Patterns on Bone Health.Nutrients. 2024 Jul 17;16(14):2289. doi: 10.3390/nu16142289. Nutrients. 2024. PMID: 39064732 Free PMC article. Review.
-
Osterix-driven LINC complex disruption in vivo diminishes osteogenesis at 8 weeks but not at 15 weeks.J Orthop Res. 2024 Sep;42(9):2007-2016. doi: 10.1002/jor.25849. Epub 2024 Apr 11. J Orthop Res. 2024. PMID: 38602438
-
Circadian Clock Deregulation and Metabolic Reprogramming: A System Biology Approach to Tissue-Specific Redox Signaling and Disease Development.Int J Mol Sci. 2025 Jun 28;26(13):6267. doi: 10.3390/ijms26136267. Int J Mol Sci. 2025. PMID: 40650041 Free PMC article. Review.
References
-
- Meunier P, Aaron J, Edouard C, Vignon G. Osteoporosis and the replacement of cell populations of the marrow by adipose tissue. A quantitative study of 84 iliac bone biopsies. Clin Orthop Relat Res. 1971;80:147–54. - PubMed
-
- Paccou J, Hardouin P, Cotten A, Penel G, Cortet B. The role of bone marrow fat in skeletal health: usefulness and perspectives for clinicians. J Clin Endocrinol Metab. 2015;100(10):3613–21. - PubMed
Publication types
MeSH terms
Grants and funding
LinkOut - more resources
Full Text Sources
Miscellaneous
