Critical Comparison of the Superoxide Dismutase-like Activity of Carbon Antioxidant Nanozymes by Direct Superoxide Consumption Kinetic Measurements
- PMID: 31509380
- PMCID: PMC6832779
- DOI: 10.1021/acsnano.9b04229
Critical Comparison of the Superoxide Dismutase-like Activity of Carbon Antioxidant Nanozymes by Direct Superoxide Consumption Kinetic Measurements
Abstract
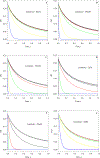
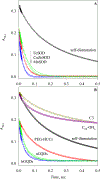
The superoxide dismutase-like activity of poly(ethylene glycolated) hydrophilic carbon clusters (PEG-HCCs), anthracite and bituminous graphene quantum dots (PEG-aGQDs and PEG-bGQDs, respectively), and two fullerene carbon nanozymes, tris malonyl-C60 fullerene (C3) and polyhydroxylated-C60 fullerene (C60-OHn), were compared using direct optical stopped-flow kinetic measurements, together with three native superoxide dismutases (SODs), CuZnSOD, MnSOD, and FeSOD, at both pH 12.7 and 8.5. Computer modeling including both SOD catalytic steps and superoxide self-dismutation enabled the best choice of catalyst concentration with minimal contribution to the observed kinetic change from the substrate self-dismutation. Biexponential fitting to the kinetic data ranks the rate constant (M-1 s-1) in the order of PEG-HCCs > CuZnSOD ≈ MnSOD ≈ PEG-aGQDs ≈ PEG-bGQDs > FeSOD ≫ C3 > C60-OHn at pH 12.7 and MnSOD > CuZnSOD ≈ PEG-HCCs > FeSOD > PEG-aGQDs ≈ PEG-bGQDs ≫ C3 ≈ C60-OHn at pH 8.5. Nonlinear regression of the kinetic model above yielded the same ranking as the biexponential fit, but provided better mechanistic insight. The data obtained by freeze-quench EPR direct assay at pH 12.7 also yield the same ranking as stopped-flow data. This is a necessary assessment of a panel of proclaimed carbon nano SOD mimetics using the same two direct methods, revealing a dramatic, 3-4 orders of magnitude difference in SOD activity between PEG-HCCs/PEG-GQDs from soluble fullerenes.
Keywords: comparative study; freeze−quench EPR; nanozymes; stopped-flow; superoxide dismutase activity.
Figures


Similar articles
-
Highly efficient conversion of superoxide to oxygen using hydrophilic carbon clusters.Proc Natl Acad Sci U S A. 2015 Feb 24;112(8):2343-8. doi: 10.1073/pnas.1417047112. Epub 2015 Feb 9. Proc Natl Acad Sci U S A. 2015. PMID: 25675492 Free PMC article.
-
A biologically effective fullerene (C60) derivative with superoxide dismutase mimetic properties.Free Radic Biol Med. 2004 Oct 15;37(8):1191-202. doi: 10.1016/j.freeradbiomed.2004.07.002. Free Radic Biol Med. 2004. PMID: 15451059
-
Perylene Diimide as a Precise Graphene-like Superoxide Dismutase Mimetic.ACS Nano. 2017 Feb 28;11(2):2024-2032. doi: 10.1021/acsnano.6b08211. Epub 2017 Jan 31. ACS Nano. 2017. PMID: 28112896 Free PMC article.
-
Superoxide dismutase nanozymes: an emerging star for anti-oxidation.J Mater Chem B. 2021 Sep 15;9(35):6939-6957. doi: 10.1039/d1tb00720c. J Mater Chem B. 2021. PMID: 34161407 Review.
-
Superoxide dismutases: ancient enzymes and new insights.FEBS Lett. 2012 Mar 9;586(5):585-95. doi: 10.1016/j.febslet.2011.10.048. Epub 2011 Nov 10. FEBS Lett. 2012. PMID: 22079668 Free PMC article. Review.
Cited by
-
Oxidized Activated Charcoal Nanozymes: Synthesis, and Optimization for In Vitro and In Vivo Bioactivity for Traumatic Brain Injury.Adv Mater. 2024 Mar;36(10):e2211239. doi: 10.1002/adma.202211239. Epub 2023 Jul 8. Adv Mater. 2024. PMID: 36940058 Free PMC article.
-
Nanozymes Regulate Redox Homeostasis in ROS-Related Inflammation.Front Chem. 2021 Oct 20;9:740607. doi: 10.3389/fchem.2021.740607. eCollection 2021. Front Chem. 2021. PMID: 34746091 Free PMC article. Review.
-
CoO Nanozymes with Multiple Catalytic Activities Regulate Atopic Dermatitis.Nanomaterials (Basel). 2022 Feb 14;12(4):638. doi: 10.3390/nano12040638. Nanomaterials (Basel). 2022. PMID: 35214972 Free PMC article.
-
Exploring Nucleic Acid Nanozymes: A New Frontier in Biosensor Development.Biosensors (Basel). 2025 Feb 24;15(3):142. doi: 10.3390/bios15030142. Biosensors (Basel). 2025. PMID: 40136939 Free PMC article. Review.
-
Unveiling the interplay between homogeneous and heterogeneous catalytic mechanisms in copper-iron nanoparticles working under chemically relevant tumour conditions.Chem Sci. 2022 Jun 8;13(28):8307-8320. doi: 10.1039/d2sc01379g. eCollection 2022 Jul 20. Chem Sci. 2022. PMID: 35919722 Free PMC article.
References
-
- Valentine JS; Doucette PA; Zittin Potter S Copper-Zinc Superoxide Dismutase and Amyotrophic Lateral Sclerosis. Annu. Rev. Biochem 2005, 74, 563–593. - PubMed
-
- Rosen DR Mutations in Cu/Zn Superoxide Dismutase Gene are Associated with Familial Amyotrophic Lateral Sclerosis. Nature 1993, 364, 36. - PubMed
Publication types
MeSH terms
Substances
Grants and funding
LinkOut - more resources
Full Text Sources
Medical
Miscellaneous

