

Cytotoxicity of 1-deoxysphingolipid unraveled by genome-wide genetic screens and lipidomics in Saccharomyces cerevisiae
- PMID: 31509475
- PMCID: PMC6789163
- DOI: 10.1091/mbc.E19-07-0364
Cytotoxicity of 1-deoxysphingolipid unraveled by genome-wide genetic screens and lipidomics in Saccharomyces cerevisiae
Abstract
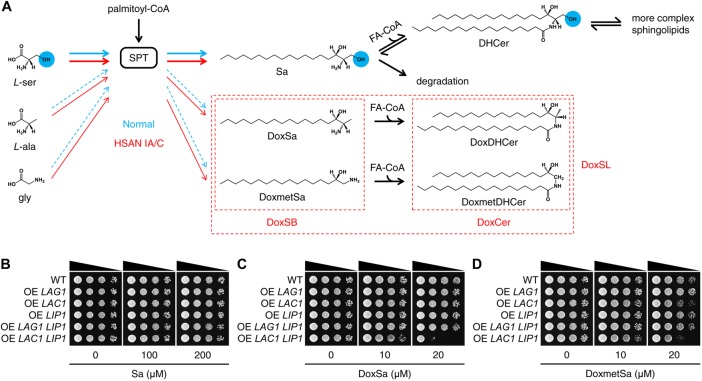
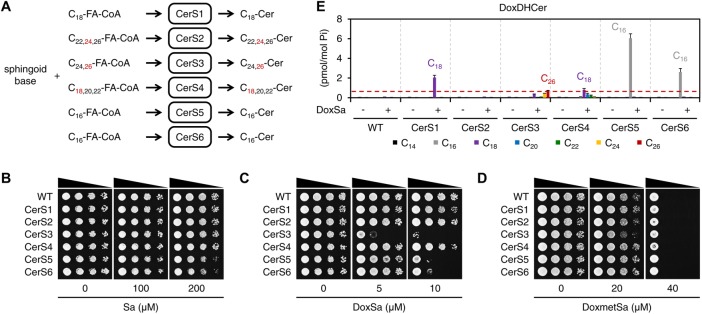
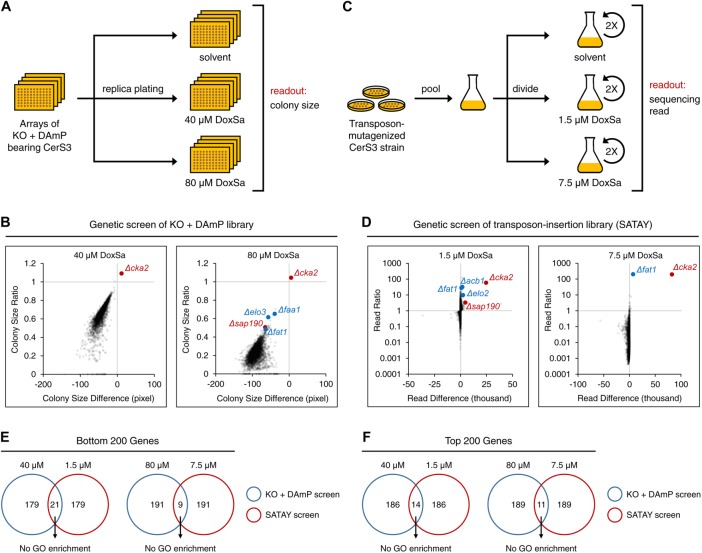
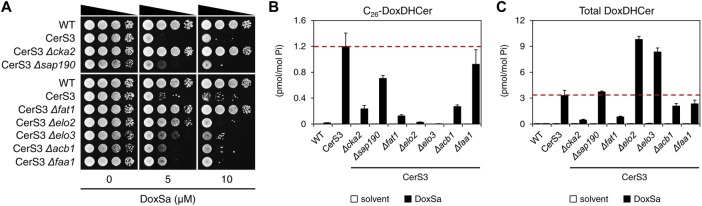
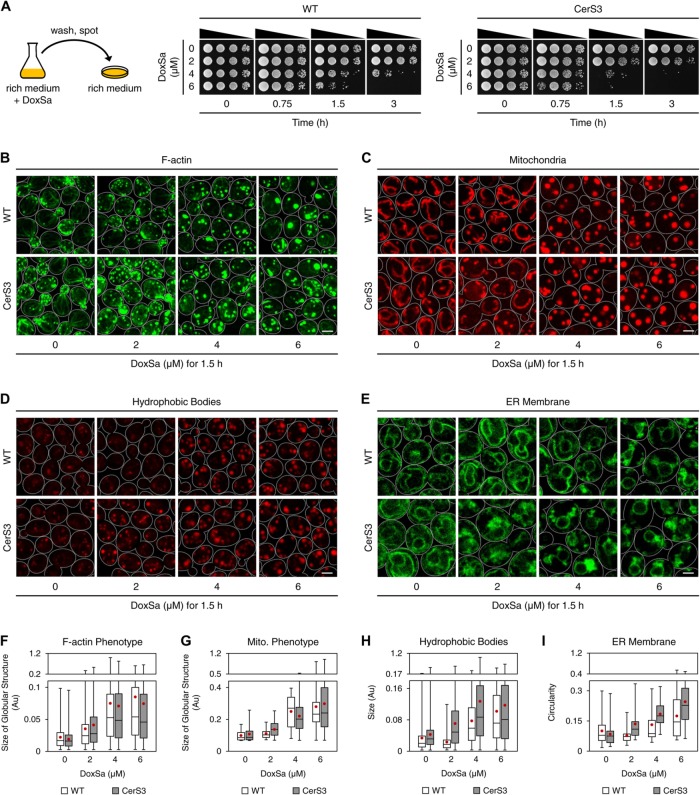
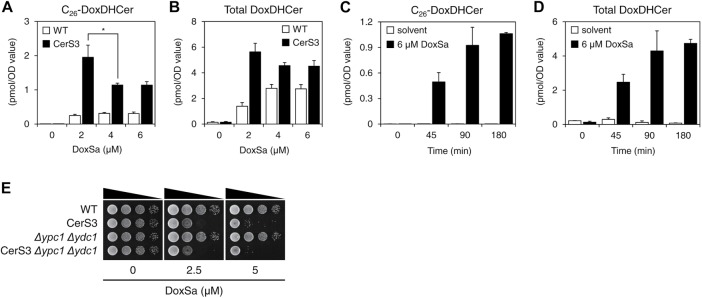
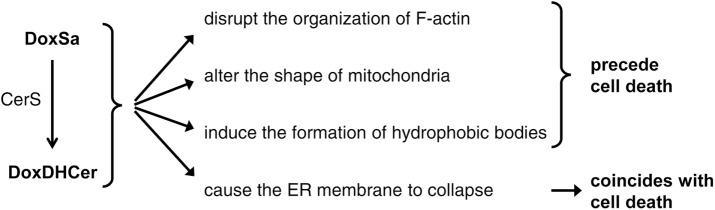
Hereditary sensory and autonomic neuropathy (HSAN) types IA and IC (IA/C) are caused by elevated levels of an atypical class of lipid named 1-deoxysphingolipid (DoxSL). How elevated levels of DoxSL perturb the physiology of the cell and how the perturbations lead to HSAN IA/C are largely unknown. In this study, we show that C26-1-deoxydihydroceramide (C26-DoxDHCer) is highly toxic to the cell, while C16- and C18-DoxDHCer are less toxic. Genome-wide genetic screens and lipidomics revealed the dynamics of DoxSL accumulation and DoxSL species responsible for the toxicity over the course of DoxSL accumulation. Moreover, we show that disruption of F-actin organization, alteration of mitochondrial shape, and accumulation of hydrophobic bodies by DoxSL are not sufficient to cause complete cellular failure. We found that cell death coincides with collapsed ER membrane, although we cannot rule out other possible causes of cell death. Thus, we have unraveled key principles of DoxSL cytotoxicity that may help to explain the clinical features of HSAN IA/C.
Figures
Similar articles
-
Chemogenetic E-MAP in Saccharomyces cerevisiae for Identification of Membrane Transporters Operating Lipid Flip Flop.PLoS Genet. 2016 Jul 27;12(7):e1006160. doi: 10.1371/journal.pgen.1006160. eCollection 2016 Jul. PLoS Genet. 2016. PMID: 27462707 Free PMC article.
-
Functions and metabolism of sphingolipids in Saccharomyces cerevisiae.Prog Lipid Res. 2006 Nov;45(6):447-65. doi: 10.1016/j.plipres.2006.03.004. Epub 2006 Apr 21. Prog Lipid Res. 2006. PMID: 16730802 Review.
-
Hereditary sensory neuropathy type 1-associated deoxysphingolipids cause neurotoxicity, acute calcium handling abnormalities and mitochondrial dysfunction in vitro.Neurobiol Dis. 2018 Sep;117:1-14. doi: 10.1016/j.nbd.2018.05.008. Epub 2018 May 18. Neurobiol Dis. 2018. PMID: 29778900 Free PMC article.
-
Serine and Lipid Metabolism in Macular Disease and Peripheral Neuropathy.N Engl J Med. 2019 Oct 10;381(15):1422-1433. doi: 10.1056/NEJMoa1815111. Epub 2019 Sep 11. N Engl J Med. 2019. PMID: 31509666 Free PMC article.
-
Protection mechanisms against aberrant metabolism of sphingolipids in budding yeast.Curr Genet. 2018 Oct;64(5):1021-1028. doi: 10.1007/s00294-018-0826-8. Epub 2018 Mar 19. Curr Genet. 2018. PMID: 29556757 Review.
Cited by
-
Demyelination in hereditary sensory neuropathy type-1C.Ann Clin Transl Neurol. 2020 Sep;7(9):1502-1512. doi: 10.1002/acn3.51110. Epub 2020 Jul 30. Ann Clin Transl Neurol. 2020. PMID: 32730653 Free PMC article.
-
Progressive alterations in amino acid and lipid metabolism correlate with peripheral neuropathy in PolgD257A mice.Sci Adv. 2021 Oct 15;7(42):eabj4077. doi: 10.1126/sciadv.abj4077. Epub 2021 Oct 15. Sci Adv. 2021. PMID: 34652935 Free PMC article.
-
Dysregulation of very-long-chain fatty acid metabolism causes membrane saturation and induction of the unfolded protein response.Mol Biol Cell. 2020 Jan 1;31(1):7-17. doi: 10.1091/mbc.E19-07-0392. Epub 2019 Nov 20. Mol Biol Cell. 2020. PMID: 31746669 Free PMC article.
-
Hijacking Transposable Elements for Saturation Mutagenesis in Fungi.Front Fungal Biol. 2021 Apr 13;2:633876. doi: 10.3389/ffunb.2021.633876. eCollection 2021. Front Fungal Biol. 2021. PMID: 37744130 Free PMC article. Review.
-
Mapping bilayer thickness in the ER membrane.Sci Adv. 2020 Nov 11;6(46):eaba5130. doi: 10.1126/sciadv.aba5130. Print 2020 Nov. Sci Adv. 2020. PMID: 33177076 Free PMC article.
References
-
- Bode H, Bourquin F, Suriyanarayanan S, Wei Y, Alecu I, Othman A, Von Eckardstein A, Hornemann T. (2016). HSAN1 mutations in serine palmitoyltransferase reveal a close structure-function-phenotype relationship. Hum Mol Genet , 853–865. - PubMed
Publication types
MeSH terms
Substances
LinkOut - more resources
Full Text Sources
Molecular Biology Databases
